Knowledge / Maintenance and reliability
Calibration and drift: traceability, uncertainty and fit for purpose
Connect a calibration result to an actual shipboard measurement, its uncertainty, drift history and the decision it must support.
On this page
A calibration certificate does not make every future reading correct. It establishes a relationship under stated conditions and carries uncertainty. The shipboard measurement adds installation, environment, resolution, operator and time effects. A useful calibration programme preserves that chain and asks whether the final result is sufficiently reliable for its intended decision.
Distinguish calibration, adjustment and verification
Calibration relates instrument indications to reference values with associated uncertainty. Adjustment changes the instrument response. Verification evaluates whether specified requirements are met. They may occur in one workshop visit, but they answer different questions. If a gauge is adjusted before its incoming error is recorded, evidence about the measurements made since the previous calibration may be lost.
The NIST traceability policy and FAQ explain that traceability belongs to a measurement result. Owning a calibrated instrument or displaying a laboratory logo does not alone establish traceability for a result obtained aboard ship. The link includes the method, reference chain, corrections and uncertainty under the actual measurement conditions. A certificate for one serial number cannot support another nominally identical gauge.
Define the measurand and required decision
“Pressure” can mean gauge pressure, absolute pressure, differential pressure or a dynamic peak. Specify the location, operating state and time behaviour. A slowly sampled transmitter may measure a steady average well while missing a short transient. Calibration of its static scale does not validate its dynamic response or the impulse line’s freedom from blockage.
Begin with the required decision and tolerance. A display used for a broad operational trend may have different needs from a reference used to set a protective switch. The complete installed loop can include sensor, transmitter, wiring, conversion, display and software scaling. Testing one element does not automatically verify the entire loop. The procedure must say which boundary was calibrated and which functional checks remain separate.
Apply corrections with a clear sign convention
If a reference of 5.00 bar produces an indication of 5.08 bar, the indication error at that point is +0.08 bar and the corresponding correction is −0.08 bar. Under a justified local model, a later indication of 5.12 bar becomes 5.04 bar after correction. The correction removes an estimated systematic effect; it does not remove uncertainty.
Do not extrapolate that one-point correction across the whole range without evidence. Zero error, span error, nonlinearity and hysteresis behave differently. Ascending and descending points can reveal different responses. Retain the correction convention in both the certificate and the calculation so a positive reported error is not accidentally added to an already high indication. Record whether the instrument was adjusted and whether the reported data are before or after adjustment.
Combine uncertainty on a consistent basis
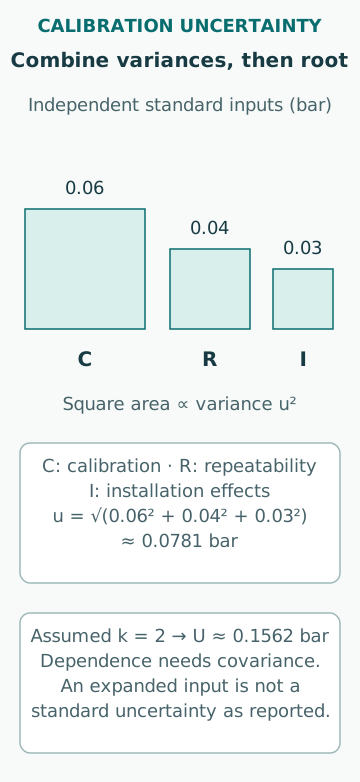
An original pressure example uses independent standard uncertainty components of 0.06 bar from calibration, 0.04 bar from repeatability and 0.03 bar from installation effects. Root-sum-square combination gives u = √(0.06² + 0.04² + 0.03²) = 0.0781 bar. Using an assumed coverage factor k = 2 gives expanded uncertainty U = 0.1562 bar, appropriately reported near 0.16 bar.
The independence and standard-uncertainty basis are essential. A certificate may already report expanded uncertainty, which must be converted using its stated factor before combination. Correlated effects require covariance terms; worst-case bounds are not automatically standard deviations. A k = 2 interval is often associated with approximately 95% coverage under suitable distribution and degrees-of-freedom conditions, not an unconditional guarantee for every uncertainty model.
Separate uncertainty from acceptance tolerance
Suppose the corrected pressure result is 5.04 bar with U = 0.16 bar, and a hypothetical requirement is 5.00 ± 0.15 bar. The central value lies inside the tolerance, but the uncertainty interval extends from 4.88 to 5.20 bar and crosses the upper limit of 5.15 bar. A simple centre-value comparison cannot provide the same assurance as a decision rule that considers uncertainty.
The agreed decision rule must define how false acceptance and false rejection are handled. Guard bands can reduce one risk while increasing the other; they should not be improvised after seeing the result. This example illustrates fit for purpose, not a universal guard-band prescription. A safety-critical setting or statutory check may have an established rule that governs the decision.
Base the interval on evidence of stability
NIST’s calibration-interval guidance does not prescribe one interval for all instruments. It points to application accuracy, external requirements, stability and environment, supported by incoming and post-calibration data. An annual sticker is an administrative choice unless connected to those considerations. Shock, over-range exposure, repair or a failed intermediate check can justify reassessment before the scheduled date.
A simple drift-budget illustration starts with 0.02 bar of allocated error and a hypothetical additional linear drift of 0.005 bar/week. Reaching a 0.10 bar allocation would take (0.10 − 0.02)/0.005 = 16 weeks. This is a sensitivity calculation, not a recommended interval: real drift may change direction, jump or depend on use. Add other uncertainty contributions and applicable requirements before making an interval decision.
Use intermediate checks without overstating them
A check against a stable reference can reveal change between calibrations. Choose points relevant to the use range and preserve the checking method. Agreement at zero does not prove span accuracy; agreement at one room temperature does not prove behaviour across an engine-room temperature range. The reference itself requires suitable control and uncertainty.
NIST’s drift discussion describes time-sequenced check measurements and warns against assuming drift continues indefinitely at one rate. Plot incoming errors and check results with repairs, transport and environmental events. If all instruments shift together, investigate the common reference or method before concluding they all drifted identically. Shared bias can survive a comparison between nominally independent instruments.
Do not confuse displayed resolution with accuracy
A digital indication that changes in steps of 0.10 bar does not have 0.10 bar accuracy merely because of its display. If rounding error is modelled as uniformly distributed between −0.05 and +0.05 bar, its standard uncertainty is 0.10/√12 = 0.0289 bar. This is one contribution, not the complete uncertainty. A display with extra digits can still carry a large bias.
Conversely, storing rounded values can erase useful evidence of drift. Preserve the original certificate and sufficiently precise working values, then round the final reported result consistently with its uncertainty. The resolution model also needs qualification: a fluctuating display, digital filtering or a stuck code may not behave like simple independent uniform rounding. The number of digits must never substitute for a measurement model.
Respond to an out-of-tolerance finding
Preserve the as-found condition and identify the period since the last credible evidence of acceptable performance. Review the measurements and decisions potentially affected, considering error direction, magnitude, use range and consequence. An out-of-tolerance result today does not prove the same error existed throughout the entire period, but it also does not justify assuming earlier results were unaffected.
Close the loop through correction, repair or replacement, suitable recalibration, installed-function checks where needed and a reasoned interval review. Retain the affected-record assessment with the instrument history. The objective is not merely a renewed sticker: it is confidence that the next measurement can support its intended decision and that previous consequential decisions have received appropriate attention.
Sources
- Metrological Traceability: Frequently Asked Questions and NIST Policy · NIST · Source check date: 2026-10-06
- Recommended Calibration Interval · NIST · Source check date: 2026-10-06
- Engineering Statistics Handbook: Drift · NIST · Source check date: 2026-10-06