Knowledge / Maintenance and reliability
CMMS failure coding: turning work orders into usable reliability data
Distinguish symptoms, failure modes, causes and actions, then connect events to the exposure and time definitions needed for reliable comparisons.
On this page
A computerized maintenance management system can contain thousands of work orders and still provide weak reliability evidence. Work orders document work; failure analysis needs events, equipment boundaries, exposure and defensible explanations. Better coding begins with those distinctions and preserves uncertainty when the cause is not known. It does not require inventing a cause merely to satisfy a mandatory field.
Separate the equipment hierarchy from the event
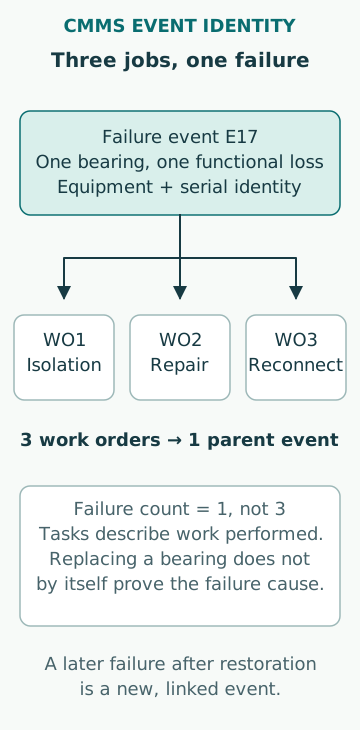
A vessel, cooling system, pump, motor and bearing occupy different hierarchy levels. Record the failed item and the affected function without counting the same event as independent failures at every level. Replacing a motor bearing may generate several work orders for isolation, mechanical work and electrical reconnection; those are related tasks within one event, not automatically three failures.
The official ISO 14224 abstract separates equipment, failure and maintenance data and describes standardized collection and quality control in its petroleum-industry scope. Only that public scope information is used here; this article does not reproduce the paid standard’s coding tables or claim marine compliance with it. The general lesson is to keep the data categories and equipment boundaries explicit.
Keep symptom, mode, mechanism, cause and action distinct
“High vibration” is an observed symptom. “Unable to deliver required flow” is a functional failure description. “Bearing surface fatigue” is a physical mechanism when supported by evidence. “Incorrect lubricant supplied” can be a contributing cause if established. “Replaced bearing and flushed oil” describes action. Storing all five in one free-text box makes later counting and comparison unreliable.
An action does not prove a cause. Replacing a seal after leakage establishes that a seal was replaced; it does not establish why it leaked. Use separate fields for observed facts, diagnosis and confidence or investigation status. A provisional cause should remain distinguishable from a confirmed one. If later inspection changes the explanation, preserve the previous entry and reason for revision rather than silently rewriting the history.
Define what counts as a failure
A routine inspection, a preventive replacement and a repair after loss of function are different event types. An incipient defect found before functional loss may still be important, but should not be mixed with complete failures without a declared rule. A standby unit found unable to start during a test is a failure even if no operational demand was missed.
Define whether repeated notifications before repair belong to one event and when recurrence becomes a new event. A leak reported on three consecutive watches should not become three independent seal failures. Conversely, a repaired item that later fails again needs a new linked event, not a perpetual reopening that hides recurrence. Consistent event boundaries are essential before any reliability rate is computed.
Choose an exposure denominator that matches the event
An original fleet example records six operating failures in 30,000 pump-hours for group A and four in 10,000 pump-hours for group B. The rates are 0.0002 and 0.0004 per pump-hour, respectively: B has fewer raw failures but twice the exposure-normalized rate. Comparing only six against four would reverse the practical interpretation.
Running-hour rates are not automatically appropriate for failures on demand, calendar corrosion or start-cycle damage. A standby-start study needs the number and definition of demands; a storage study may need elapsed calendar exposure. Include units that did not fail in the exposure total. NIST’s reliability-data guidance explains why surviving observations still contain information. Missing runtime cannot be treated as zero exposure.
Keep downtime different from active repair time
For six hypothetical events, suppose total unavailable time is 96 h and hands-on repair totals 24 h. Mean downtime is 16 h per event while mean active repair time is 4 h per event. The remaining average 12 h can include diagnosis, waiting, access and verification. A dashboard labelled simply “MTTR” can conceal which quantity it uses.
Record timestamps for detection, functional loss when known, work start, repair completion, successful verification and return to service. These are not always identical. A technician may complete the repair while the equipment remains isolated awaiting test. State the time-zone convention and handle crossings of midnight consistently. Negative or implausible durations should be investigated, not automatically converted to a plausible value.
Design a small usable code dictionary
Codes should be specific enough to support decisions and simple enough to be selected consistently. Define each code, its boundary, examples and common exclusions. Offer “unknown” or “not yet determined” where evidence is insufficient, with a route for later review. Forcing a detailed cause at first notification invites guesswork and makes a complete-looking database less truthful.
Use controlled equipment-specific choices when they help distinguish real modes. “Other” needs a short explanation and periodic review; a growing cluster may justify a new code. Do not multiply codes for spelling variants or different action verbs that describe the same event. Keep dictionary version and mappings so a change in classification does not appear as a sudden improvement in failure performance.
Audit evidence, not just filled fields
Check a sample of coded events against logs, photographs, measurements and service reports. Are identity, symptom and action consistent? Does the stated cause have evidence? Does the exposure belong to the same equipment and period? A 100% field-completion score says little if every cause is the default option.
Useful quality measures include duplicate-event frequency, unresolved equipment identity, missing exposure, implausible dates and the proportion of provisional causes that receive follow-up. These measures should improve the record rather than punish honest uncertainty. A decline in reported failures after a burdensome form is introduced may indicate reporting friction, not a more reliable fleet. Ask maintainers how the coding process behaves during real work.
Retain the identity of replaced and repaired units
A pump tag describes a location or function, while a serial number describes a physical unit. When a repaired pump is exchanged with a store spare, the tag can stay unchanged while the unit’s history moves. If the database attaches every lifetime to the tag alone, it can falsely assign one unit’s operating hours and previous failures to another.
Link installation and removal dates, serial identity, repair scope and meter readings. Keep the equipment position available for system-level analysis and the physical-item history for component-level analysis. When serial tracking is unavailable, state the limitation instead of manufacturing a precise lifetime. This distinction also helps identify whether recurring trouble follows a particular repaired unit or stays with the shipboard location and its operating conditions.
Turn the record into a decision and feedback
Use the cleaned data to ask bounded questions: which seal type repeats under comparable duty, how much downtime is parts waiting, or whether a revised task reduced verified assembly errors. Match the population and observation rules before comparing periods. Attach uncertainty and investigate changes in reporting practice before assigning cause to a trend.
Feed findings back into task instructions, parts specifications and code definitions, then retain enough history to assess the result. The CMMS becomes useful reliability evidence when another analyst can reconstruct what happened, what was observed, what remained unknown and how much opportunity there was for failure. A colourful dashboard cannot substitute for those foundations.
Sources
- ISO 14224:2016 official abstract · ISO · Source check date: 2026-10-06
- Engineering Statistics Handbook: Censoring · NIST · Source check date: 2026-10-06