Knowledge / Maintenance and reliability
Condition monitoring with missing data: silence is not healthy operation
Keep equipment condition separate from measurement availability, identify biased gaps and prevent stale or substituted values from masking uncertainty.
On this page
A monitoring system can stop receiving useful data while the machinery continues running. If the display carries forward its last normal value, the absence of an alarm can be mistaken for evidence of health. Reliable condition monitoring treats data freshness and quality as part of the evidence and keeps an unknown machine state distinct from a measured normal state.
Define what a missing observation means
A missing value can result from an unpowered sensor, communication failure, acquisition overload, maintenance isolation, invalid range or deliberate event-based reporting. These causes imply different interpretations. A machine stopped under a documented mode may legitimately produce no vibration record; a running machine with a failed sensor has lost coverage. Both should not be coded as the same blank without context.
Preserve the expected reporting rule. For fixed-rate acquisition, a gap can be measured against expected slots. For exception reporting, no new value may mean the quantity has not changed, but only if communication and source health remain valid. An arbitrary timeout cannot distinguish those cases without the protocol and equipment contract. Record operating mode, source status and the reason for planned missingness whenever available.
Keep source time, receipt time and quality together
A server may receive or republish an old observation at a recent time. The age of the physical measurement is therefore different from the age of the network message. A dashboard refresh does not prove the sensor has measured again. Time-zone errors, clock jumps and unsynchronized devices can also make an apparently fresh sequence misleading.
The OPC Foundation DataValue specification explicitly carries a value, status and source/server timestamps and distinguishes good, uncertain and bad usability. This is a useful public example of preserving quality with data, not a claim that every ship uses OPC UA. The client must interpret the actual source semantics; merely storing a numeric value discards information needed to judge its use.
Look for missingness related to the fault itself
Random loss of otherwise comparable readings is different from loss concentrated at high vibration, high temperature or heavy network traffic during an upset. If the sensor saturates during severe events and those values are discarded, the retained data selectively describe quieter operation. This is an example of informative missingness: the reason a value is absent is related to the condition being studied.
Missing-not-at-random is a statistical possibility to investigate, not a label proven by one gap. Compare gaps with load, operating mode, sensor diagnostics and independent event logs. Distinguish missingness explainable by recorded conditions from missingness that still depends on the unobserved value. Simple averaging or model fitting on the remaining data may be biased; more sophisticated imputation does not remove the need to justify its assumptions.
Show how gaps change the denominator
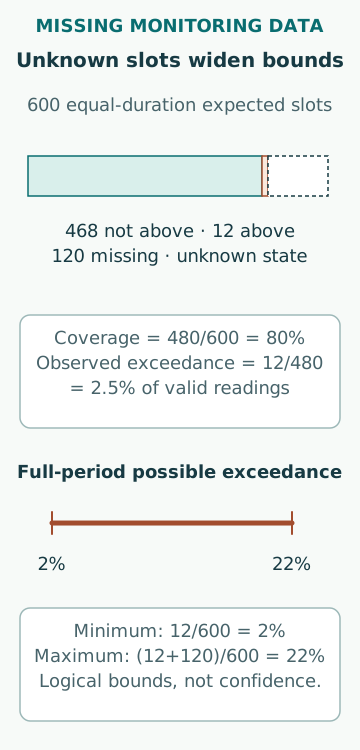
In an original example, a fixed-rate period should contain 600 readings. Only 480 are valid, and 12 of those exceed an analysis threshold. The observed exceedance fraction is 12/480 = 2.5%, while coverage is 480/600 = 80%. Calling the full period “97.5% normal” silently assumes the missing 120 readings behave like the observed ones.
Without additional assumptions, the full-period exceedance fraction could range from 12/600 = 2% to (12 + 120)/600 = 22%. This simple bound assumes each slot represents equal duration and each missing value either exceeds the threshold or does not. It is not a confidence interval or a forecast. It makes the information gap visible and shows why a low observed alarm fraction cannot establish a healthy unobserved period.
Do not convert absent values into reassuring numbers
Replacing missing values with zero can produce an artificial reduction in temperature, pressure or vibration. Last-observation carry-forward can draw a smooth healthy-looking line through an outage. Linear interpolation can erase a short peak between valid endpoints. Each method adds a model; none is a neutral formatting choice when the output supports a condition decision.
If estimates are needed for an analytical purpose, retain an explicit mask identifying measured, estimated and invalid values. Keep the raw data and document the method, maximum gap and assumptions. Do not let an imputed normal value silently clear a live alarm or certify acceptable machinery condition. A plot may show a dashed estimate for continuity while the decision logic still treats the interval as unobserved.
Assess coverage where the consequences are largest
Overall monthly completeness can hide a concentrated outage during manoeuvring or peak load. Report coverage by relevant operating mode, component and time window. Ninety-nine percent completeness is not reassuring if the missing one percent contains every high-risk transition. Likewise, many samples from low-load operation cannot replace missing evidence at the duty where the fault appears.
Cross-check apparent gaps against acquisition settings. Deadband, averaging and event-trigger logic can reduce stored data intentionally while also suppressing important transients if misconfigured. NIST’s data-quality and synchronization presentation illustrates timing lag and missed sensor overshoot in a manufacturing context. The general measurement lesson applies: collection and storage settings shape what events remain observable.
Monitor the monitoring chain
Use appropriate health indicators for power, sensor diagnostics, communication, processing and alarm delivery. A heartbeat from a gateway establishes something about the gateway; it does not necessarily prove every attached sensor is measuring correctly. A flatline can represent steady operation, a frozen value or a failed conversion. Diagnose it using context and redundant evidence rather than a universal flatline rule.
Define what happens when trustworthy coverage is lost: who is informed, what alternative observation is available and what operating limitation follows from the consequence. That response must be integrated with the vessel’s approved arrangements. A data-quality alert should be distinguishable from a machinery alarm while remaining visible enough to prevent false reassurance. Suppressing repeated quality alerts without resolving their cause can make the system quietly blind.
Describe gap duration as well as completeness
Two records can both have 80% completeness while providing very different protection. In a 600 s period sampled once per second, 120 missing samples could form one continuous 120 s blackout or many isolated short gaps. A 30 s abnormal event could be wholly hidden in the long blackout. The same completeness percentage does not describe that temporal exposure.
Report the longest gap, relevant gap distribution and coverage during required operating states, alongside the overall fraction. Choose allowable data age from the process dynamics and response need, with the applicable engineering assessment. A threshold suitable for a slowly changing tank inventory may be unsuitable for a rapidly developing bearing or pressure event. Data-quality limits should follow the decision’s time scale rather than the dashboard’s refresh rate.
Verify recovery and preserve the gap
When communication returns, distinguish newly measured data from delayed buffered data. Check timestamp order, duplication, quality state and the time at which trustworthy live coverage actually resumed. Backfilled history can improve later analysis but cannot retroactively provide the warning that was unavailable during the outage. Record that distinction in any performance claim.
Assess whether the outage affected an active condition decision and whether the missingness reveals a systematic weakness at certain loads or locations. Keep the gap and its cause in the history after repair. A credible monitoring report states both what the machinery evidence indicates and when the system could not observe it. Unknown is a meaningful state that protects the integrity of the conclusion.
Sources
- OPC Unified Architecture Part 4: DataValue · OPC Foundation · Source check date: 2026-10-06
- Data Quality / Time Synchronization · NIST · Source check date: 2026-10-06