Knowledge / Maintenance and reliability
Thermography aboard ships: emissivity, reflections and electrical load
Interpret thermal images as radiometric measurements with surface, viewing and load conditions, rather than treating every bright pixel as a hot defect.
On this page
A thermal camera receives infrared radiation and estimates surface temperature using a measurement model. On a ship, shiny metal, warm machinery, changing ventilation and variable electrical load can all change the image. Reliable thermography therefore starts with the origin of the radiation and the operating state, then asks whether the observed pattern supports a particular fault.
Separate emitted, reflected and transmitted radiation
For an opaque surface, radiation reaching the camera includes the surface’s own emission and radiation reflected from its surroundings. The atmosphere and any infrared window add transmission and emission effects. The camera cannot infer all these contributions merely from the colour of a pixel. A shiny busbar can reflect a nearby hot object and appear hotter than its own surface; it can also reflect a cool background and conceal heating.
FLIR’s thermographic measurement guidance identifies emissivity, reflected apparent temperature, distance and atmospheric conditions as relevant inputs. This establishes the measurement boundary, not a universal setting. Emissivity depends on surface condition and the relevant spectral band; a material name alone is insufficient. Polished, oxidized and painted versions of the same metal may behave differently.
Use a radiation example with honest limits
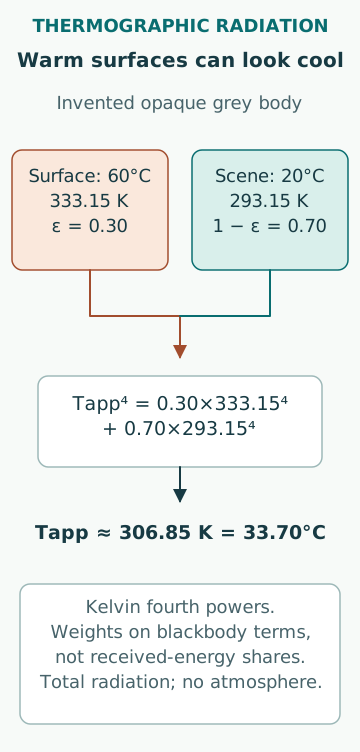
An original grey-body illustration assumes an opaque surface at 60°C, surroundings at 20°C, emissivity 0.30, no atmospheric loss and total hemispherical radiation. The blackbody-equivalent apparent temperature satisfies Tapp⁴ = 0.30 × 333.15⁴ + 0.70 × 293.15⁴, with temperatures in kelvin. It is about 306.85 K, or 33.70°C. A genuinely warm surface can therefore produce a much cooler uncorrected apparent temperature.
This fourth-power example is not the inversion algorithm of a particular thermal camera. Real instruments operate over a spectral band and include optics, calibration and additional corrections. It demonstrates the direction and scale of a possible reflection effect, not the exact display reading. Using degrees Celsius directly inside the fourth power would be physically wrong, and choosing a convenient emissivity to force an expected answer would not validate the measurement.
Distinguish reflected apparent temperature from air temperature
The reflected scene can contain exhaust surfaces, people, lamps and cool open space. Its effective radiative temperature is not automatically the local air temperature. Changing viewing angle may move a reflection while a true surface feature remains tied to the component, although angle also changes surface radiative behaviour. Several safe views can help test the hypothesis without proving it on their own.
An appropriate high-emissivity reference patch can sometimes support a measurement, but it must be compatible with the surface, temperature and electrical safety arrangements. Never approach or modify energized conductors merely to improve an image. Preparation requiring physical access belongs in an authorized safe work process. Record the patch location and allow thermal equilibration; the reference is useful only if it actually follows the target surface temperature.
Resolve the target before trusting a temperature
A small terminal may occupy too few detector pixels at a long distance. The displayed value then mixes target and background radiation, often suppressing the hottest local feature. Digital zoom enlarges the existing pixels; it does not restore missing spatial information. Focus, optical resolution and the instrument’s measurement-spot requirements matter independently of the image’s attractive appearance.
FLIR’s temperature-measurement instructions distinguish measurement parameters and external-optics effects. Preserve the distance, viewing direction, focus and window information in the survey record. Ordinary glass or an enclosure cover must not be assumed transparent in the camera’s infrared band. A thermal image through an unsuitable barrier can be an image of the barrier or its reflections rather than the intended component.
Measure load alongside electrical temperature
Resistive heating is I²R. In an invented fixed-resistance connection of 0.50 milliohm, 100 A produces 5 W and 200 A produces 20 W. Doubling current quadruples heat generation in that simple calculation. A cooler connection observed at half the previous current is not necessarily improved. Record phase currents, load duration and relevant ambient conditions with the image.
Surface temperature rise does not necessarily scale exactly with I². Resistance changes with temperature; conduction, convection and radiation change with temperature and geometry. A recently loaded joint may still be warming. Thus extrapolating a measured rise to full load using a simple square law can be misleading. The heat-generation calculation explains the importance of load matching; it is not a validated full-load temperature prediction.
Compare similar components and investigate asymmetry
Comparing similar phases or parallel connections can reveal an unusual pattern, but first check whether current, construction and cooling are comparable. A heavily loaded phase may legitimately be warmer. A localized temperature rise centred on a connection suggests a different hypothesis from broad heating along an entire conductor. Geometry and heat conduction can move the visible maximum away from the actual heat source.
Use the image to select corroborating checks by competent personnel under the applicable electrical procedures. Possible explanations include contact resistance, overload, imbalance, cooling restriction and reflected radiation. Do not infer torque or prescribe live tightening from a thermogram. A thermal observation identifies a condition requiring interpretation; mechanical or electrical work requires its own isolation, specification and verification.
Allow for thermal lag and changing ventilation
A component’s surface does not instantly reach its final temperature after a load change. In a deliberately simplified first-order model, the fraction of final temperature rise reached after time t is 1 − exp(−t/τ), where τ is a thermal time constant. If τ is assumed to be 10 minutes, the rise reaches 39.3% after 5 minutes and 95.0% after 30 minutes. The same healthy or defective connection can therefore look different solely because one survey began earlier after loading.
Real assemblies may have several time constants, variable cooling and changing resistance. The example cannot supply a universal waiting period. Record recent load history and whether the observed temperature is stable. An opened cabinet, a nearby ventilation fan or a changed machinery-space airflow can alter cooling during the survey itself. Repeat measurements should preserve these conditions or explain the difference.
Keep diagnosis separate from severity classification
An anomalous thermal pattern and an unacceptable equipment temperature are different findings. The first may justify investigation before a temperature limit is approached; the second may require action even when all similar components look equally warm. Compare with the applicable component rating, duty and approved criteria, while retaining the measurement uncertainty.
A report should state the observed pattern, numerical result, relevant comparison and remaining uncertainty separately. This avoids turning an instrument’s default colour palette into an engineering severity scale. If the critical surface was obscured or the emissivity uncertain, say which part of the conclusion remains qualitative.
Preserve a radiometric and operational record
Keep the radiometric file, visible-light context image, component identity, camera settings, load and environmental notes. An exported coloured JPEG may retain only appearance, preventing later adjustment of measurement assumptions. Automatic colour scaling can make a small temperature range look dramatic or hide an important difference between surveys. Compare numerical scales and conditions, not colour alone.
Classify what was inspected, what was obscured and what could not be evaluated at meaningful load. A clean image of accessible terminals does not establish the condition of hidden internal contacts. Repeatability requires a documented route and comparable operating opportunity. Where the consequence is serious, an uncertain image should lead to a suitable verification path rather than an unqualified “normal” status.
Sources
- Thermographic measurement techniques · FLIR · Source check date: 2026-10-06
- Measuring temperatures · FLIR · Source check date: 2026-10-06