Knowledge / Maintenance and reliability
Ultrasonic leak surveys: detection, quantification and background noise
Locate compressed-air leaks while keeping acoustic evidence, flow estimates and achievable energy savings as separate quantities.
On this page
An ultrasonic survey listens for sound associated with escaping gas. It can locate leaks that are difficult to hear in a machinery space, but sound level is not a universal flow meter. Distance, direction, pressure, leak geometry and background noise shape the evidence. A good survey records those conditions and verifies repairs before claiming an energy benefit.
Understand the source of the signal
Gas passing through a leak can create turbulent pressure fluctuations over a broad frequency range. An ultrasonic detector selects part of that sound and presents an audible or visual indication; an acoustic imager estimates the direction of sound sources using multiple microphones. Neither device identifies the chemical species simply because an acoustic hotspot appears.
The US Department of Energy compressed-air tip sheet describes ultrasonic leak detection as part of a continuing repair programme. Its industrial savings examples are not measured shipboard savings. The practical value is locating avoidable demand and documenting its removal. Detection is one step in a chain that also includes access, repair quality, compressor control and verification.
Control distance, angle and obstruction
For an ideal point source in a free field without additional absorption, doubling distance reduces sound-pressure level by about 6 dB. That relationship is a propagation illustration, not a field correction valid for every leak. High-frequency absorption, reflections and directional jets can change the observed level. A bulkhead or pipe cluster may block the direct sound path while reflecting another source toward the detector.
Fluke’s public acoustic-leak white paper discusses source geometry, pressure, distance, angle and atmospheric effects. Use those dependencies to explain why repeated observations need comparable conditions. Do not copy an instrument-specific flow estimate to another detector or reproduce a manufacturer’s proprietary conversion as a universal physical law.
Distinguish a leak from legitimate pneumatic activity
Air tools, automatic drains, valve exhausts and process blow-offs may generate sound near an actual leak. Some are intentional functions; others are abnormal continuous losses. Observe the operating cycle and identify the component before tagging a repair. A sound that disappears when a valve changes state may be useful diagnostic evidence, but changing the process solely for a survey requires the appropriate operational control.
Record inaccessible and masked areas explicitly. Lowering detector sensitivity until background disappears may also hide a small leak. Increasing sensitivity can overload the display with unrelated sources. Use suitable frequency selection and safe alternative viewpoints according to the instrument instructions. A negative survey result means no qualifying signal was detected under those conditions, not that the entire system is leak-free.
Treat a displayed flow as an estimate
Acoustic flow estimates depend on calibration or empirical relationships and entered conditions. A crack, loose threaded fitting and round orifice with the same actual flow need not produce identical sound. Uncertainty may be larger outside the instrument’s characterized pressure, distance or leak-type range. Preserve the estimate, method, pressure and confidence limitations rather than reporting a deceptively exact number.
Volumetric flow also needs a reference condition. A litre per minute at line pressure is not a litre per minute of free air at a stated reference pressure and temperature. The same gas mass occupies a different volume when expanded. Avoid adding quantities with different bases. For cost calculations, use a consistent free-air or standardized basis shared by the leak estimate and compressor specific-energy data.
Build a dimensional energy estimate
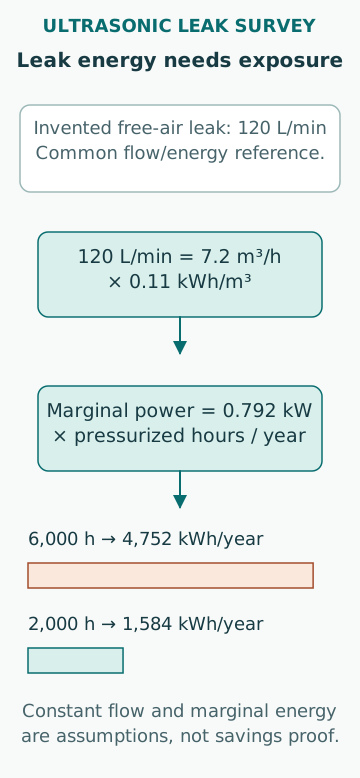
Assume an original example of 120 L/min leakage expressed as free air at a stated common reference. This is 0.120 m³/min, or 7.2 m³/h. Assume a relevant marginal compressor energy of 0.11 kWh per reference m³ and pressurization for 6,000 h/year. The illustrative energy associated with the leak is 7.2 × 0.11 × 6,000 = 4,752 kWh/year. At an assumed 0.20 currency units/kWh, this corresponds to 950.4 currency units/year.
The result is conditional on constant flow, constant applicable specific energy and the stated operating hours. It is not a quoted electricity tariff or guaranteed saving. If the leak is present only 2,000 h/year, the same arithmetic gives 1,584 kWh/year. A line that is isolated overnight must not be costed as continuously pressurized. Separate measured inputs from assumptions so the estimate can be revised after better evidence.
Connect air reduction to compressor response
An unloaded compressor can still consume power. Removing demand may reduce loaded time without reducing total electrical energy by the same proportion, depending on control strategy, storage, sequencing and minimum operating constraints. Conversely, enough demand reduction may allow one machine to stop. The marginal energy effect must be checked at the system boundary.
Compare power and delivered useful demand before and after repair over similar operating periods. Hold pressure requirements and production or shipboard duty in view. A lower pressure can reduce leakage but may also affect equipment performance; a generic savings calculation does not authorize a pressure change. Record other changes during the comparison so a compressor-control adjustment is not wrongly credited to the repaired fitting alone.
Prioritize repair by consequence as well as cost
A modest leak in a critical control-air supply can deserve priority over a larger noncritical service-air leak. Pressure recovery, redundancy, contamination and the effect on connected actuators matter. The repair plan needs correct parts, isolation and an opportunity that preserves required ship functions. Acoustic evidence alone does not establish whether a fitting may safely be tightened in service.
Use a stable leak identifier, location photograph, operating pressure, survey date, estimated flow basis, access constraint and work-order link. Keep repair status separate from detection status. A tagged leak awaiting a gasket remains a loss; a closed work order without a post-repair check remains unverified. This distinction keeps the inventory useful for both reliability planning and energy accounting.
Show uncertainty in the economic ranking
If the original 120 L/min estimate plausibly spans 80–160 L/min while other assumptions remain fixed, the illustrative energy spans 3,168–6,336 kWh/year. At the same assumed unit cost, the range is 633.6–1,267.2 currency units/year. This is a scenario interval, not a statistically established confidence interval. The ordering of two similar leaks may change within those ranges.
Use that uncertainty to choose the next measurement. A large, accessible leak may justify repair regardless of precise flow, while an expensive access job may warrant a better estimate. Avoid summing several instrument estimates to many decimal places when their dominant errors are shared, such as an incorrect pressure or distance setting. Common bias does not average away merely because more leaks were surveyed.
Verify locally and then at system level
Resurvey the repaired point under comparable pressure and acoustic conditions. Confirm that the original signal is gone or appropriately reduced and that no new leak was created nearby. A local acoustic check supports repair closure; a system power or flow comparison supports the energy claim. These are complementary forms of evidence, not substitutes.
Keep a repeat-survey programme because seals, drains and connections can deteriorate again. Review recurring locations for installation, material or operating causes instead of repeatedly accepting repair as the final answer. Do not extend a compressed-air acoustic survey into certification that a hazardous-gas space is safe. Gas detection, atmosphere testing and emergency response require their dedicated methods and applicable procedures.
Sources
- Minimize Compressed Air Leaks · US Department of Energy / ENERGY STAR · Source check date: 2026-10-06
- Leak Rate Quantification Method for Acoustic Imaging Cameras · Fluke · Source check date: 2026-10-06