Knowledge / Navigation and marine safety
Chart datum and tidal height: putting depths on the same reference
Convert water levels and chart depths through an explicit vertical reference, including negative tides, timing and transformation uncertainty.
On this page
Adding a tide height to a charted depth is valid only after their vertical zeros have been reconciled. A half-metre datum mistake can survive otherwise careful arithmetic. Working with elevations makes the conversion and its limitations visible.
Name the zero before adding the numbers
A vertical datum is the reference surface from which height or depth is measured. NOAA’s Tidal Datums reference distinguishes tidal datums, station datum and geodetic vertical datums, and warns against extending a local relationship into another area without supporting measurements. Its definitions describe NOAA products; another hydrographic authority may use a different chart datum. The chart notes and water-level product metadata establish the applicable reference.
Latitude and longitude do not answer the vertical question. A tide gauge can report metres above station datum while a chart gives metres below chart datum, and a land survey can use a geodetic height. All three numbers may be correct but incompatible for direct addition. Record datum name, location, units and the epoch or realization where relevant. A label such as “sea level” is too vague to establish compatibility.
Use elevations to derive the sign convention
Choose an upward-positive reference z. Let chart datum have elevation zC, the seabed zB and the water surface zW. Charted depth d is zC − zB, while water height above chart datum η is zW − zC. Adding gives total depth D = d + η = zW − zB. The intermediate reference cancels only because both terms use the same zC.
This derivation is more reliable than memorizing “add the tide.” Water below chart datum has negative η and reduces total depth. A drying height describes a feature above chart datum, so its corresponding signed depth is negative. Changing the sign convention is allowed in a calculation, but every input and equation must change consistently. A positive-looking display value should never decide the sign by itself.
An original datum-conversion example
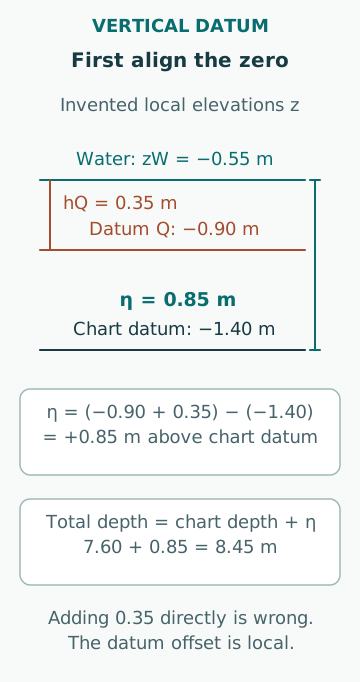
Assume a local benchmark reference is chosen only for this example. Chart datum is at zC = −1.40 m, and a water-level product uses datum Q at zQ = −0.90 m. It reports water height hQ = +0.35 m. Therefore zW = zQ + hQ = −0.55 m, and water height above chart datum is η = zW − zC = +0.85 m. With charted depth 7.60 m, total water depth is 8.45 m.
Directly adding the unconverted 0.35 m to 7.60 m would give 7.95 m, an error of 0.50 m. The datum offset is a local relationship, not a universal conversion between two named systems. If the chart datum elevation changes along an estuary, a single constant offset cannot automatically be applied over the whole route. The required transformation needs its own location and uncertainty information.
A low-water datum is not a guaranteed minimum
Mean lower low water and lowest astronomical tide are different constructions. One is derived from selected observed low waters over a defined period; the other concerns predicted astronomical minima under a stated convention. Neither label alone promises that every actual water surface will remain above the datum. Wind, pressure and other non-astronomical influences can change the observed level.
For a fictional charted depth of 4.20 m and observed η = −0.25 m, total depth is 3.95 m. If an operator incorrectly substitutes +0.25 m, the result becomes 4.45 m, overstating depth by 0.50 m. The error is twice the magnitude of the wrongly signed height. This simple check is useful because below-datum values can be discarded by a spreadsheet that silently assumes all tides are positive.
Time belongs to the measurement
NOAA CO-OPS API documentation explicitly distinguishes datum, units, time zone, interval and data product. Those are part of a numerical value’s meaning. UTC, local standard time and local time with daylight-saving adjustment are not interchangeable. A product generated now can contain an older observation or a future prediction; generation time is not measurement time.
Assume an illustrative water level changes at 0.18 m per hour over a short interval. A forty-minute timing mismatch corresponds to 0.12 m under a linear approximation. The rate may change near high or low water, so this is a sensitivity check rather than a tidal interpolation method. Arrival-time uncertainty and the age of the latest observation should remain visible instead of being hidden behind an exact minute on a schedule.
A gauge and a ship occupy different places
A gauge measures the water level at its installation. A ship may be several kilometres away, across a sill, within a river gradient or in another part of a harbour. A nearby gauge is not automatically representative simply because it is the closest one on a map. The transfer from station to passage location needs a justified relationship, especially where tidal phase and amplitude vary.
Prediction, observation and numerical forecast also answer different questions. A prediction can supply the astronomical component, an observation describes a measured past or present state, and a forecast can model additional processes. Comparing them requires matching datum, time and location first. A residual obtained before those checks can be a reference mismatch masquerading as a weather effect.
Preserve uncertainty through the transformation
A datum conversion does not improve the original depth measurement. It adds a transformation whose uncertainty must be considered. Suppose the water-level and datum-offset errors are modelled as independent and zero-mean, with standard uncertainties of 0.10 m and 0.08 m respectively. Their combined standard uncertainty is sqrt(0.10² + 0.08²) = 0.128 m. That calculation is valid only under the stated independence and statistical interpretation.
If instead the two numbers are conservative bounds, their sum 0.18 m has a different meaning. If they share the same benchmark or processing error, covariance matters. Neither result includes chart depth error, spatial water-level variation, vessel draught or motion. State what is outside the uncertainty budget; a tidy total can otherwise be mistaken for complete clearance assurance.
Drying heights provide a second sign check
Consider a fictional flat ledge with drying height 1.10 m above chart datum. Its signed chart-depth equivalent is −1.10 m. At a water level 1.70 m above datum, the water over that ledge is only 0.60 m. The calculation is 1.70 − 1.10, not 1.70 + 1.10. This says nothing about surrounding unsurveyed terrain or the suitability of crossing the ledge.
Keeping the ledge, datum and water surface as three elevations makes the relationship obvious. It also prevents a spreadsheet designed for positive soundings from treating a drying feature as an underwater depth. Data type is part of the measurement: a drying height cannot be imported into a sounding column without an explicit transformation.
Keep a reproducible vertical reference record
A useful record contains the exact chart and water-level source, datum labels, units, timestamps, location, transformation applied and any assumptions about spatial transfer. Keep the original values beside the converted values. That makes a later sign or datum error discoverable; retaining only the final total removes the evidence needed to reconstruct it.
Common errors include treating MSL as any convenient vertical zero, importing feet into a metre calculation, transferring a station offset to another estuary, confusing predicted high water with slack current and forgetting that height clearance above the sea may use a different chart reference from soundings. This article establishes reference consistency only. Vessel clearance, port limits and passage decisions require additional validated information and the applicable procedures.
Sources
- Tidal Datums · NOAA CO-OPS · Source check date: 2026-10-06
- CO-OPS Data Retrieval API · NOAA CO-OPS · Source check date: 2026-10-06