Knowledge / Navigation and marine safety
ECDIS safety contour and safety depth: different settings, different effects
Follow the logic from an entered ECDIS depth to soundings, available contours, cell changes and alert interpretation.
On this page
Safety contour and safety depth are often discussed together, but they answer different display questions. Their interaction becomes clearest when the desired depth falls between available contours. A detailed fictional comparison shows why an apparently conservative screen can still be misunderstood.
Two thresholds perform different jobs
In the established IMO MSC.232(82) performance standard, sections 5.8–5.9, the safety contour separates the relevant depth areas and when spot soundings are selected for display, the safety depth makes those equal to or shallower than that value more conspicuous. The entered contour may be replaced by a deeper available contour. These are distinct functions even when a manufacturer presents linked controls. The standard was adopted on 5 December 2006; the approved standard and software actually installed on the vessel must be identified before treating a menu description as universal.
Think of the safety depth as a numerical comparison applied to individual depth information and of the safety contour as a boundary chosen from the chart’s available contour structure. A conspicuous sounding does not create a new contour around itself. Equally, a bold contour does not show every isolated object within the deeper area. Understanding both prevents a common false inference: that one well-chosen setting completely describes all depth hazards.
The requested value and the active contour can differ
The selection behaviour is explained in IHO S-66, edition 2.0.0, section 7.6: the equal contour is used when available, otherwise the next deeper contour is selected. This is a property of the available chart data, not a calculation of new seabed measurements. The following fictional values deliberately differ from any real port requirement.
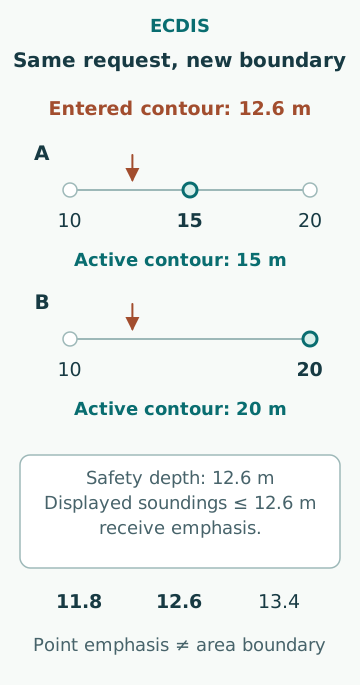
Assume a separately justified assessment produces an entered contour value of 12.6 m. Cell A contains 10 m, 15 m and 20 m contours, so the active contour is 15 m. Cell B contains 10 m and 20 m contours, so it becomes 20 m. The numeric request has not changed, but the represented boundary has. Moving into a different cell can therefore change the useful visual interpretation without any change in vessel draught. MSC.232(82), section 5.8.3, also calls for an indication when the default or next-deeper selection conditions in sections 5.8.1–5.8.2 occur.
Do not confuse a depth label with an area classification
In cell A, consider three invented soundings: 11.8 m, 12.6 m and 13.4 m. With spot soundings selected for display and a safety depth of 12.6 m, the first two meet the shallower-than-or-equal numerical condition for emphasis; 13.4 m does not. Yet the 13.4 m sounding can lie on the shallow side of the active 15 m safety contour. The apparent mismatch is the expected result of two different comparisons.
This example says nothing about whether the 13.4 m location is navigable. That requires the complete vertical assessment, data quality, local seabed geometry, water level and vessel state. Conversely, a deeper sounding inside an area cannot validate the unsounded space around it. A point value, an area minimum and a contour each represent different information. Read the object information and geometry rather than making a decision from font weight alone.
Trace the physical assessment into a setting
The software field should be the end of a transparent assessment. An original example uses 10.2 m static draught, 0.4 m assumed dynamic increment, 1.0 m required residual margin and 0.6 m separately allocated uncertainty allowance. The illustrative total depth requirement is 12.2 m. If a justified usable water level is 0.5 m above the same chart datum, the equivalent chart-depth requirement is 11.7 m. These are invented inputs, not recommended margins or a universal setting formula.
The allowance must say what it includes. If the dynamic increment already contains a particular motion effect, adding the same effect again under uncertainty double counts it. If the usable tide is merely an optimistic prediction, subtracting it as a guaranteed credit understates the requirement. Equipment and company procedures may handle water level differently; the arithmetic explains consistency, not which value to enter on an unidentified ECDIS.
Separate route checking from route monitoring
A route check tests a stored route and its defined corridor against encoded data using the selected parameters. Route monitoring evaluates the current navigation situation using live inputs and configured warning functions. Passing a route check yesterday does not prove that today’s position, draught, selected route or look-ahead configuration matches the conditions of that check.
For an original time-scale illustration, a vessel moving at 9 kn covers 0.60 NM in four minutes, or 1,111.2 m. A four-minute look-ahead therefore reaches that along-track distance only under the assumed constant ground speed and implementation geometry. It is not a stopping-distance allowance. Changing speed, sensor latency, turn geometry and the checked width can change the relation between an indication and the physical time available.
Colour and isolated dangers require context
Depth shading is a portrayal convention. Its appearance depends on palette, depth-area settings and the information displayed. “Safe water” in a display legend is therefore conditional on data and selected parameters; it is not an independent certification of the passage. An isolated rock, wreck or obstruction may require attention within an otherwise deeper region.
Zooming does not create survey detail. A point symbol may stay similar in screen size while the represented feature has real spatial extent and position uncertainty. A screenshot without scale, chart identity and settings can therefore conceal the very issue being assessed. The analytical task is to connect the encoded object to the actual hazard extent and to the vessel’s swept area, including uncertainty, rather than interpreting blank pixels as measured clear water.
Verify the behaviour with a controlled example
A useful familiarization exercise uses approved training data and records the entered contour, active contour, selected safety depth, available contours, displayed sounding emphasis and any indication of default or next-deeper contour selection. Repeat across two cells with different contour intervals. Compare the change expected from the data with the observed change. This tests understanding of the actual device rather than memorization of a generic screenshot.
For alert functions, identify the trigger, the message produced, the acknowledgement state and the underlying condition. Acknowledging a contour warning does not deepen the water or repair the position source. Restoring a setting after training also needs an explicit final-state check. Tests on operational equipment must follow the vessel’s authorized arrangements so that an exercise does not silently change a live navigation configuration.
Recognize the common setting errors
Frequent reasoning errors include assuming the entered contour exists, reducing the contour to remove inconvenient shading, copying settings from another loading condition, equating an unhighlighted sounding with sufficient clearance and assuming an absent alert proves that no hazard exists. Each substitutes an interface appearance for an underlying physical or data claim.
A useful handover records the reason for the values, the active contour actually selected, any cell-boundary changes and unresolved data limitations. It also identifies the equipment approval framework, since newer ECDIS generations need their own applicable documentation. The result should let another navigator reconstruct why the display looks as it does and what would require reassessment. No general article can approve a vessel-specific depth setting.
Sources
- MSC.232(82): ECDIS performance standards · IMO · Source check date: 2026-10-06
- S-66 Facts about Electronic Charts and Carriage Requirements · IHO · Source check date: 2026-10-06