Knowledge / Risk analysis methods
FMEA detection and diagnostic coverage: what is actually revealed?
Define diagnostic coverage by failure mode, rate weighting, overlap and detection time, then distinguish revealing a fault from controlling its consequence.
On this page
A diagnostic claim must answer a specific question: which failures are revealed, under which conditions and soon enough for which response? A statement that a device has self-tests does not answer that question. An FMEA can connect each failure mode to an observable indication, while an FMEDA can add quantitative failure-rate and diagnostic information. The value of either analysis depends on the completeness and credibility of that mapping.
Start with the relevant failure population
The research by Goble and Brombacher describes FMEDA as an extension that maps component failure modes to diagnostic capability and distinguishes safe from dangerous failure coverage. Its public abstract and section excerpts also acknowledge limits associated with known failure modes. Before calculating coverage, define the function and the subset of failures relevant to the question.
A failure can be dangerous for one required function yet have another effect in a different application. A diagnostic result supplied for an electronic device does not automatically include an external sensor, wiring path or final element. Name the analysis boundary and the safety function before using a percentage. Otherwise a valid component figure can be applied to a larger system it never represented.
Define a rate-weighted coverage measure
The public IEC61508 commented-version excerpt hosted by ANSI defines dangerous diagnostic coverage using detected dangerous failure rate divided by total dangerous failure rate, under the constant-individual-failure-rate assumption stated in IEC 61508-4 section 3.8.6, Note 2. With the stated boundary, DC = λDD/(λDD + λDU). This is a rate-weighted measure for the represented dangerous failures, not the fraction of test cases passed or the fraction of worksheet rows carrying an alarm entry.
The classification also needs a detection criterion and time basis. A failure revealed only after its harmful effect has already occurred cannot be silently treated as equivalent to a timely diagnostic for the protective function. State whether the classification concerns detection alone or the wider response model. The latter includes what happens after detection and cannot be inferred from DC alone.
Compare rate weighting with a row count
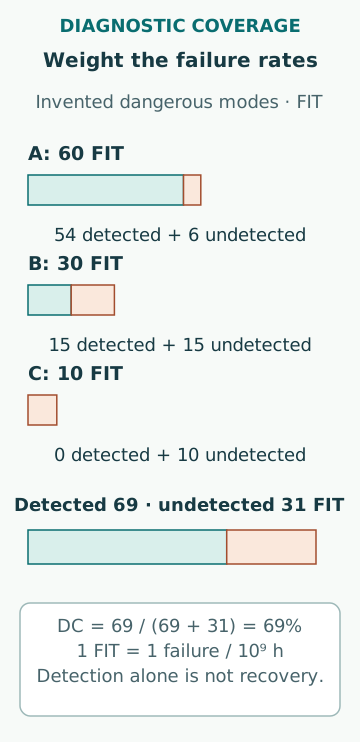
Use the same constant-rate model for three invented dangerous failure-mode groups with rates 60, 30 and 10 FIT, where 1 FIT means one failure per 10⁹ operating hours. Assume their detected fractions are respectively 90%, 50% and 0%. Detected rate is 60 × 0.90 +30 × 0.50 +10 × 0 = 69 FIT, while the total is 100 FIT. The resulting dangerous coverage is 69%, and undetected rate is 31 FIT.
A simple average of the three percentages is 46.7%, a different answer because it gives equal weight to unequal failure-rate groups. Counting two groups with some detection out of three would yield 66.7%, which answers yet another question. None of those alternatives is the specified rate-weighted DC. The hypothetical rates illustrate the arithmetic; they are not evidence for any real product or maritime function.
Do not add overlapping diagnostic claims
Suppose diagnostic A reveals failures representing 70 FIT and diagnostic B reveals 60 FIT from the same 100 FIT population. If failures representing 50 FIT are revealed by both, their union is 70 +60 −50 = 80 FIT, so combined coverage is 80%. Adding the first two numbers would count shared modes twice and produce an impossible 130% of the population.
The familiar expression 1 −(1 −DCA)(1 −DCB) would give 88% from 70% and 60%, but it requires an appropriate independence model that the given overlap does not satisfy. A mode-by-mode map is stronger evidence than assuming independent coverage because the diagnostics have different names. Also examine failures that disable both the diagnostic and the function it is meant to monitor.
Keep diagnostic scheduling and latency visible
Texas Instruments’ public FMEDA guidance distinguishes continuous, periodic and one-time diagnostics and relates execution frequency to the system’s relevant safety timing constraints. A diagnostic option selected in an analysis must correspond to what the application actually executes. A startup-only test does not automatically provide continuing detection during a long operating period.
For an isolated periodic-test example, assume failures arrive uniformly relative to a 60 s diagnostic cycle and are always revealed at the next execution. Waiting time to detection lies between 0 and 60 s, with mean 30 s, before processing or response delays. The average is not a maximum. If the function requires a faster response, the study needs its actual timing model rather than a coverage percentage detached from the test schedule.
Distinguish fault revelation from successful control
HSE’s control-systems discussion links safety integrity to detection and correction of dangerous failures, including diagnostic intervals and repair conditions. An alarm can reveal a fault while the required service remains unavailable. A detected category therefore needs a defined resulting state and response; it is not shorthand for no consequence.
For example, identifying loss of one channel may leave a redundant system operating with reduced tolerance, or it may require a transition to another supported condition. The outcome depends on architecture, available capacity, response timing and the condition of other channels. A repair-time assumption should include the actual time the relevant function remains degraded, not merely the hands-on replacement duration.
Ask whether the indication covers a plausible wrong value
A range check can reveal an output outside its permitted electrical range but fail to reveal a plausible-looking value that is wrong for the process. Similarly, a communication heartbeat can show that messages are arriving without proving that the measurement is accurate. These are different failure modes, so crediting one test for both requires evidence of how it distinguishes them.
In a generic sensor chain, compare open-circuit, frozen-value, offset, wrong scaling and wrong-source scenarios. Some may be detectable through another independent physical relationship; others may remain latent in a particular operating mode. Do not treat every deviation as equally testable during steady conditions. A diagnostic that needs changing process input may have little opportunity to reveal a frozen value while the process is genuinely constant.
Match verification evidence to the claimed modes
GSFC-HDBK-8004 connects FMECA with detection, isolation and recovery assessment. For a diagnostic claim, the evidence should identify which modes were represented, how the fault was introduced or otherwise assessed, the observed indication and timing, and the limits of the method. A successful demonstration for one mode does not establish coverage of an untested class by naming it in the same row.
Simulating a software input may test downstream logic while excluding the physical sensing element or communications path. Physical fault injection has its own representation and safety constraints. Analysis, test and field evidence can complement one another, but their coverage boundaries must remain visible. The examples here do not prescribe fault injection on live equipment or replacement of an approved verification procedure.
Report the remaining blind spots
A useful conclusion states total represented failure rate, detected and undetected subsets, diagnostic overlap, execution schedule and the assumed response after revelation. It also identifies excluded external elements, unmodeled modes and uncertainty in the rate distribution. A neat percentage cannot repair an incomplete failure population or an unavailable diagnostic.
Common mistakes are averaging per-mode percentages without weights, adding overlapping diagnostics, treating a heartbeat as proof of correct data, crediting a test that is not executed and equating detection with recovery. The FMEA should retain those distinctions so a reviewer can see what the diagnostic genuinely reveals and what remains dependent on another measure. No universal coverage value or integrity level follows from the label self-diagnostic.
Sources
- Goble and Brombacher1999:Using FMEDA to measure diagnostic coverage · Reliability Engineering & System Safety / Elsevier · Source check date: 2026-10-06
- IEC61508:2010 commented-version public excerpt · IEC,publicexcerpthostedbyANSI · Source check date: 2026-10-07
- Functional Safety Information,SFFS246 · TexasInstruments · Source check date: 2026-10-06
- Control systems · UKHSE · Source check date: 2026-10-06
- GSFC-HDBK-8004,2024 · NASA/GSFC · Source check date: 2026-10-06