Knowledge / Risk analysis methods
FMEA risk-priority numbers: equal scores and unequal consequences
Test the interpretation of severity–occurrence–detection products using tied scores, ordinal recoding and sensitivity examples while preserving the actual failure consequence.
On this page
A risk-priority number can make a large FMEA easy to sort, but the product does not preserve every reason a failure matters. Different combinations of severity, occurrence and detection scores can produce the same number. A smaller product can also conceal a more serious consequence. The useful question is how the score is used in a decision, which information it discards and whether the decision remains justified when the underlying judgments are uncertain.
State the scoring convention explicitly
The historical FMEA discussion in NASA-HDBK-8739.19-2 illustrates the conventional product RPN = S × O × D. In such a scheme, S represents a severity rating, O an occurrence rating and D a detection-related rating, with the direction and definitions set by the selected method. These are ratings unless the method establishes something more specific. The numerical product has no automatic unit of events per year, probability or expected loss.
Retain the actual scoring tables, edition and application scope. In many conventional schemes a larger D means poorer detection, but that convention must be confirmed rather than assumed. A number copied from another organization may have a different meaning. This article uses invented ordinal examples to examine the arithmetic; it does not introduce an approval threshold for a vessel or project.
Inspect equal products before treating them as ties
Suppose mode A has S = 10, O = 2 and D = 5, giving RPN 100. Mode B has S = 4, O = 5 and D = 5, also giving 100. The product treats them as tied, while the consequence ratings and occurrence judgments differ. A decision maker still needs the actual consequence, basis of the occurrence class and relevant requirements to decide what treatment is necessary.
The tie is not evidence that the modes create equal expected harm. To calculate expected harm, one would need defensible probabilities or frequencies and a meaningful consequence measure on a compatible basis. Ordinal ratings do not provide those quantities merely by being multiplied. Keep the three dimensions and the failure narrative visible beside the product.
Understand the ordinal-scale problem
John Bowles’ research assessment identifies the use of ordinal ranks as numerical quantities, duplicate products and varying sensitivity among RPN’s interpretation problems. An ordinal scale preserves ordering, but does not establish equal intervals or meaningful ratios. Severity 8 is ranked above severity 4 in the chosen scheme; it is not necessarily twice the harm.
Multiplication can still be adopted as a declared decision heuristic, but its weights and trade-offs then need justification. It should not be presented as a measured physical law. A team using the score consistently may gain organizational convenience while retaining the obligation to examine high-consequence modes and uncertain assumptions individually.
Use a recoding example to expose hidden trade-offs
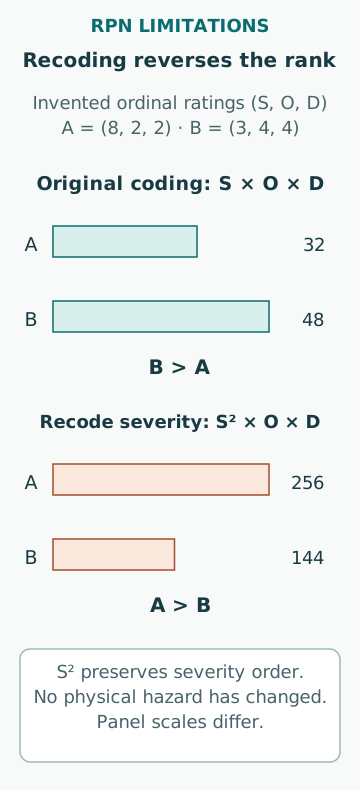
Take two different invented rows: A = (S 8, O 2, D 2), product 32; B = (S 3, O 4, D 4), product 48. Now imagine that the same severity order is encoded with S² instead of S, leaving the other scores unchanged. A becomes 64 × 2 × 2 = 256, while B becomes 9 × 4 × 4 = 144. The numerical priority reverses even though the order of every original severity judgment is unchanged.
This is a mathematical illustration, not a proposed replacement scoring system. Squaring is a strictly increasing recoding for the positive severity ranks, so it preserves their order while changing their spacing. The example shows that multiplication imposes extra assumptions about those spacings and their interaction with the other factors. A ranking decision should acknowledge that choice rather than attribute the reversal to a changed physical hazard.
Distinguish score sensitivity from physical improvement
With S and D fixed, changing O from 4 to 5 increases the product by 25%. Changing O from 1 to 2 doubles it. Both are one-step changes on the ordinal scale, but the product reacts differently. Conversely, a claimed reduction from 5 to 4 does not establish a 20% reduction in failure probability unless the underlying scale and evidence support that quantitative interpretation.
A revised score should identify what physically changed: prevention of the failure mechanism, detection before a specified consequence, recovery capability or the consequence itself. Rewording a rating justification without changing evidence is not a demonstrated improvement. Retain the before/after basis so a reviewer can distinguish a real engineering change from a more optimistic judgment.
Keep severe consequences outside an arbitrary cut-off
A rule that ignores all rows below one product threshold can exclude a high-severity case whose other ratings happen to be low. A defensible decision process needs to preserve mandatory requirements, unacceptable failure effects and any designated high-consequence review independently of the convenience of sorting by RPN. The appropriate rules must come from the actual governing framework.
For a separate example, a severity 10 row with O 1 and D 2 has product 20, below a severity 4 row with O 4 and D 4 at 64. That arithmetic does not authorize neglect of the first row. Explain how the decision addresses its consequence and the evidence behind the low occurrence and detection ratings. Do not invent a universal severity threshold or copy another industry’s acceptance table without its context.
Do not confuse detection rank with diagnostic coverage
A detection score can describe an ordinal judgment about a particular opportunity to reveal a cause or mode. It is not automatically a percentage of dangerous failure rate revealed by diagnostics. The function, timing, test method and covered failure population need to be defined before a quantitative coverage claim is made. A score of 2 does not mean 98% coverage or a 2% probability of missing a failure.
Likewise, detecting a fault is not the same as preventing the consequence. A diagnostic can be late, its indication can be unavailable to the required decision maker, or recovery may need another failed support service. Preserve the causal explanation rather than allowing a low D rating to silently represent successful detection, response and repair all at once.
Use richer decision records where they are needed
IEC60812’s public description notes alternative prioritization approaches and a criticality-matrix method among the standard’s developments. This supports selecting and documenting an approach appropriate to the analysis purpose, rather than assuming one product is the only FMEA output. The paid method details are not reproduced here, and no alternative label is claimed to guarantee correct decisions.
A practical record can show severity, occurrence evidence, detection mechanism, uncertainty and required action as separate fields. A decision table may preserve severity-specific rules, while a quantitative model may be useful where defensible rates and consequence measures exist. Each option still needs consistent definitions and review of dependencies. Replacing multiplication with another formula does not eliminate weak data or an incomplete failure model.
Maintain the link to evidence and engineering action
GSFC-HDBK-8004 provides a public example of communicating FMECA through multiple views and updating the analysis with new knowledge. Its space-mission scoring conventions are not adopted as maritime criteria. The transferable lesson is to retain enough information that a priority can be explained and revised when the system or evidence changes.
Common mistakes are treating equal products as equal risk, interpreting score ratios as probability ratios, closing a severe case below an arbitrary cut-off, and lowering a rating without verifying the claimed improvement. A useful conclusion states why a mode needs action, what action changes the failure chain and what evidence will demonstrate the result. The score can help organize that discussion, but the failure mechanism and consequence remain the reason for it.
Sources
- NASA-HDBK-8739.19-2,2010 · NASA · Source check date: 2026-10-06
- Bowles:An Assessment of RPN Prioritization in FMECA,Journal of the IEST47(1),51–56 · Journal of the IEST · Source check date: 2026-10-06
- IEC60812:2018 public description · IEC · Source check date: 2026-10-06
- GSFC-HDBK-8004,2024 · NASA/GSFC · Source check date: 2026-10-06