Knowledge / Risk analysis methods
PSA scope and levels: what maritime adaptations can and cannot claim
Define maritime risk endpoints and model boundaries while keeping nuclear PSA level terminology, consequence calculations and acceptance criteria in their proper context.
On this page
Probabilistic safety assessment is a way to connect accident scenarios, their likelihoods and their consequences. Its usefulness depends on the question and boundary of the model. Maritime analysts can learn from established PSA methods, including event trees, fault trees and uncertainty analysis, without assuming that another industry’s levels or numerical criteria transfer directly. A model of loss of ship function, a model of pollutant release and a model of harm to people answer different questions even when they share the same initiating scenario.
Begin with the decision and endpoint
Define the decision before selecting a modelling tool. Comparing two support arrangements, identifying dominant failure combinations and estimating the frequency of a particular environmental consequence require different boundaries and evidence. Loss of one pump may be relevant as an intermediate event, while the decision concerns insufficient service at a consumer or loss of propulsion during a defined operation.
An endpoint should state the physical condition, observation horizon and exposure basis. Blackout is incomplete unless the relevant electrical boundary and duration are clear. Release is incomplete unless the containment boundary and material are identified. A precise endpoint does not make the model complete, but it allows another reader to determine what its probability or frequency actually describes.
Keep established nuclear level names in context
NRC’s PRA overview describes Level 1 in terms of core-damage sequences, Level 2 in terms of accident progression and radioactive release, and Level 3 in terms of offsite consequences. These are nuclear endpoints. Labelling a ship machinery fault tree Level 1 PSA does not establish equivalence to that scope.
A maritime study can define its own staged analysis, for example functional loss followed by release and consequence assessment. It should name those stages directly and explain the analogy if nuclear terminology is discussed. There is no reason to imply that a numerical target for one nuclear endpoint is a universal limit for machinery availability, navigation safety or marine pollution.
Distinguish equipment reliability from scenario risk
NASA’s public reliability-and-PRA discussion characterizes PRA as scenario based and concerned with likelihood and consequences. Equipment reliability is one input to that argument. A component with a relatively high failure probability may have little effect on a given endpoint if another adequate path remains; a rare shared support failure can affect several critical functions at once.
The distinction also runs in the other direction. Improving an equipment metric does not necessarily reduce every relevant risk. An operating change can reduce wear while increasing stored inventory or altering human response demands. A scenario model should expose which pathways the improvement changes and which remain. A single aggregate reliability percentage is not a substitute for that causal explanation.
Work through three explicitly defined stages
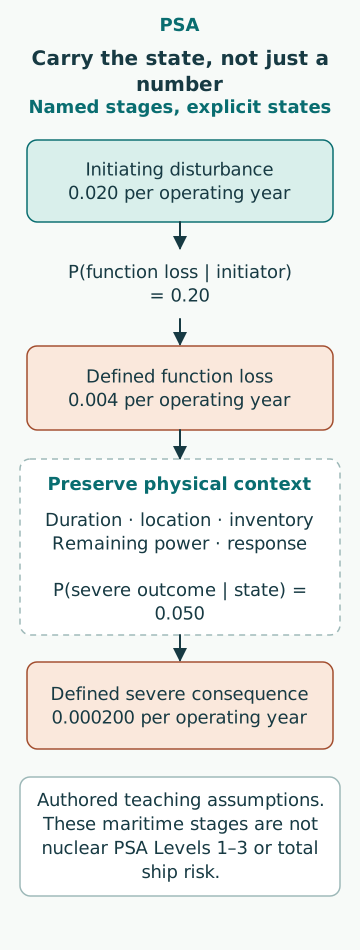
Take an original hypothetical model in which a specified initiating disturbance occurs at frequency 0.020 per operating year. Conditional on that disturbance, the defined protective-function loss has probability 0.20. The resulting function-loss frequency is 0.004 per operating year. This number concerns the named functional state, not damage by itself.
Suppose the probability of a defined severe consequence, conditional on that function-loss state and its modelled conditions, is 0.050. The severe-consequence frequency is 0.004 × 0.050 = 0.000200 per operating year. The two conditional factors belong to different questions. The latter must not be replaced by a generic consequence score or an unrelated accident percentage merely because both can be written as numbers.
Carry state information into consequence assessment
The same function-loss label can conceal different physical states. Duration, remaining power, location, weather, material inventory and available response can change the outcome. If those attributes affect consequence progression, the functional analysis needs to preserve them or provide their conditional distribution to the next model.
For the numerical example, the assumed 0.050 must represent the same population of function-loss states generated by the preceding stage. If a design change alters that population, the old averaged consequence probability may no longer apply. Holding it constant is an assumption to justify, not an automatic property of the staged calculation. Clear interfaces prevent one model’s simplification from becoming another model’s unsupported fact.
State what the assessment does not cover
IAEA SSG-3 (Rev. 1) explicitly addresses development and application of Level 1 PSA for nuclear power plants. A maritime adaptation likewise needs an explicit scope: relevant operating states, initiating hazards, system boundaries and outcomes. Borrowing a modelling technique does not borrow the source publication’s complete coverage or regulatory standing.
A machinery model may exclude collision, grounding, fire, flooding, maintenance states or external assistance. Those exclusions can be reasonable for a bounded question, but they prevent the result from being presented as total ship risk. Some excluded hazards can also create dependencies inside the included scenario. The boundary statement should therefore explain whether they are absent by scope or represented indirectly through conditional inputs.
Separate different kinds of uncertainty
Parameter uncertainty concerns values within a chosen model, such as a failure probability or response-time distribution. Model uncertainty concerns the representation itself, such as whether recovery is possible or two events share a cause. Incompleteness concerns scenarios or mechanisms not represented. Increasing the number of Monte Carlo samples addresses none of the latter two automatically.
For an original sensitivity check, let the conditional severe-consequence probability range from 0.020 to 0.10 while the function-loss frequency remains 0.004 per operating year. The resulting frequency spans 0.000080 to 0.000400 per operating year, a factor of five. This is a stated parameter range, not a confidence interval. Its usefulness depends on why the endpoints are plausible and which other uncertain assumptions were held fixed.
Use the model for the decision it can support
A bounded PSA can reveal shared vulnerabilities, rank scenario contributions within its scope and compare explicitly modelled alternatives. It can guide where better evidence would matter. It cannot establish vessel certification, statutory compliance or operational acceptability merely because its calculated frequency is small. Those judgements involve the applicable requirements, consequence criteria and broader engineering evidence.
Comparisons also need consistent scope. One alternative should not receive detailed failure modelling while another is represented by optimistic aggregate assumptions. Keep exposure, endpoint definitions and data treatment comparable, and explain material differences. A risk reduction claim is most credible when the reader can trace the changed mechanism rather than only a difference between two final numbers.
Make the scope visible in the result
The result should identify the modelled endpoint, initiating-event set, operating states, exposure unit, important dependencies, numerical method and source limitations. Report the dominant pathways and sensitivity alongside the headline value. A named stage or level is useful only if it helps the reader understand those boundaries.
Maritime PSA gains value from disciplined adaptation of established methods. It should retain the logic of scenarios and uncertainty while defining its own relevant functions and consequences. The strongest claim is the one the model and evidence actually support: a specific answer to a specific maritime question, with its limits clear enough for the next engineering decision.
Sources
- Probabilistic Risk Assessment · US NRC · Source check date: 2026-10-07
- Reliability and Probabilistic Risk Assessment – How They Play Together · NASA NTRS · Source check date: 2026-10-07
- SSG-3 (Rev. 1), 2024 · IAEA · Source check date: 2026-10-07