Knowledge / Machinery and energy
Air-lubrication systems: under-hull air distribution and net power savings
Separate friction reduction from total resistance, calculate draft-dependent air pressure, and compare propulsion savings with compressor consumption on a common fuel-energy basis.
On this page
Air lubrication introduces air beneath a hull to change the near-wall flow and reduce part of its frictional resistance. The compressor or blower consumes energy to create and maintain that air distribution. A useful evaluation therefore asks two questions together: how much propulsion demand is avoided, and how much additional energy is needed to keep the air where it is effective?
The target is a component of total resistance
Total ship resistance includes more than skin friction. Wave-making, form-related effects, appendages and other contributions do not automatically fall by the same percentage as the treated friction component. A local reduction in wall shear over part of a bottom surface is not directly a whole-vessel fuel-saving percentage.
MHI describes supplying air beneath the bottom to reduce propulsive resistance. The extent and persistence of coverage matter. Bubble, air-layer and cavity arrangements are not interchangeable designs; their geometry, air requirement and interaction with the surrounding flow differ. A result from one hull and operating condition cannot simply be transferred to another.
Distribution is a hydraulic and gas-supply problem
The supplied air must reach the intended release points at sufficient pressure and with a suitable distribution between branches. Unequal losses, changes in local water pressure or an impaired outlet can change that distribution even when total compressor flow appears normal. Hull geometry, trim, speed and motion affect how air travels and escapes beneath the vessel.
Silverstream’s system overview includes an air-balancing module distributing compressor air to release-unit branches. This illustrates the physical importance of distribution rather than just a total air-flow number. More air is not automatically better: extra flow may add compressor consumption with diminishing friction benefit or alter downstream interactions.
Worked example: draft creates a minimum pressure requirement
For a simple hydrostatic screen, assume seawater density 1025 kg/m³, atmospheric pressure 101.325 kPa absolute and injection depth 7 m. Static water pressure above atmosphere is ρgz = 1025 ×9.81 ×7 = 70386.75 Pa ≈ 70.387 kPa. Add a stipulated 20 kPa for the air-supply path and outlet allowance: required supply is about 191.712 kPa absolute.
At 12 m depth, the static contribution becomes 120663 Pa = 120.663 kPa and the same simplified allowance gives 241.988 kPa absolute. Local hull pressure during motion can differ from the hydrostatic value, and a real compressor selection needs flow, pressure losses and operating margins. The calculation explains the draft effect; it does not predict compressor electrical power. MHI explicitly identifies draft as a major blower-pressure driver.
Keep air-flow reference conditions explicit
Compressor intake or free-air delivery volume is not the same as compressed discharge volume or bubble volume under the hull. For a given mass flow, gas volume changes with absolute pressure and temperature. Reporting only “m³/h” without the reference can therefore make two systems or operating points look comparable when they are not.
Use actual compressor performance at the required pressure and intake condition, including motor and control losses. The following 180 kW compressor input is a separate stipulated example input, not a result derived from the preceding draft calculation. If draft, flow or discharge pressure changes, that consumption must be reevaluated rather than held fixed by habit.
Worked example: gross friction benefit at constant speed
Assume baseline propulsion shaft power 8000 kW at a fixed ship speed, with 60% of total resistance attributed to the friction component considered in the model. Suppose air lubrication reduces that component by 10% and leaves other resistance components and overall propulsive efficiency unchanged. Total resistance then falls by 0.60 ×0.10 = 6%.
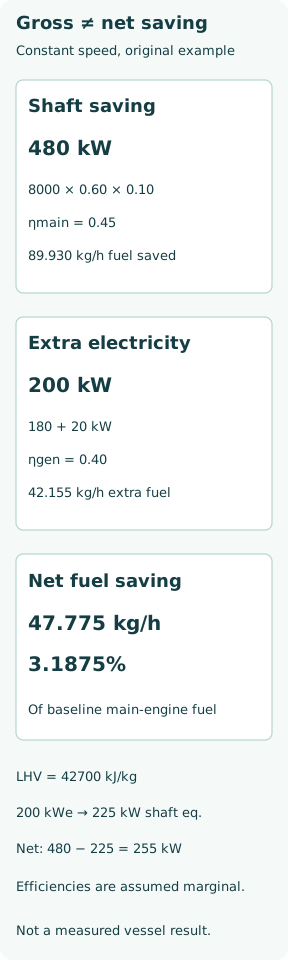
Under those explicit assumptions, required shaft power falls by 8000 ×0.06 = 480 kW to 7520 kW. This is gross shaft saving before air-system consumption. The 10% friction reduction is invented for the example; it is not a manufacturer claim or a measured vessel result. Changes in wake, propeller interaction or trim would require a more complete propulsion model.
Convert shaft saving and electrical demand to one fuel basis
Assume compressor electrical input 180 kW plus 20 kW of other air-system loads, totaling 200 kW. Let main-engine fuel-to-shaft efficiency be 0.45, generator fuel-to-electrical efficiency 0.40, and both use fuel with LHV 42700 kJ/kg. Treat these efficiencies as constant marginal values for this example. Other ship electrical loads are unchanged.
Gross main-fuel saving is 480 ×3600/(0.45 ×42700) = 89.930 kg/h. Extra generation fuel is 200 ×3600/(0.40 ×42700) = 42.155 kg/h. Net fuel saving is 47.775 kg/h. Baseline main-engine fuel is 8000 ×3600/(0.45 ×42700) = 1498.829 kg/h, so the net saving is 3.1875% of that declared baseline, not 6%.
A net power number also needs a declared reference
In main-shaft-equivalent terms, the 200 kW electrical load corresponds to 200 ×0.45/0.40 = 225 kW of main shaft output at the same fuel input. Net equivalent benefit is 480 −225 = 255 kW. Directly subtracting 200 electrical kW from 480 shaft kW would instead give 280 kW, but that mixed-boundary difference would not represent the fuel saving under these unequal efficiencies.
For diesel-electric propulsion, a different common bus boundary may be more natural. For changing generator dispatch, use the incremental fuel consumption caused by the added load; a constant efficiency may be inadequate. If the denominator is total ship fuel rather than baseline main-engine fuel, the percentage must be recalculated with all unchanged auxiliary consumption included.
Verification must hold the comparison condition steady
At constant speed, reduced resistance can appear as reduced shaft power. At constant shaft power, it can appear as increased speed. Counting both as separate savings would double-count the same hydrodynamic benefit. A comparison needs matched or corrected displacement, draft, trim, weather, current, hull condition and control mode, plus synchronized shaft and air-system power measurements.
The ITTC committee report identifies the need for care in ALS evaluation and air-injection scaling. Repeated controlled comparisons and uncertainty assessment are more informative than one short change in a dashboard average. A trial showing gross shaft reduction should still state whether compressor and auxiliary loads were included in the reported net result.
Optimize for the operating profile, not one favourable point
The net benefit can vary across speed, draft, weather and loading conditions. Periods when the system is unavailable or its energy cost exceeds its benefit affect the voyage result. Air outlets, distribution equipment and compressor condition should therefore be evaluated with the expected operating profile rather than a single design-speed percentage.
The engineering account should connect air mass/volume reference, delivery pressure, branch distribution, coverage evidence, gross propulsion change and additional energy supply. The aim is not maximum air injection; it is a verified net reduction on a declared energy and service boundary. Neither a component friction reduction nor a compressor nameplate alone establishes that result.