Knowledge / Machinery and energy
Ammonia fuel: toxicity, containment and the limits of concentration readings
Examine ammonia exposure pathways, two-phase dispersion, measurement boundaries and release mitigation through explicit mass balances and source-specific limits.
On this page
An ammonia fuel assessment must follow the substance from its containment to the places where people or the environment could encounter it. A pressure indication, a gas reading and an observed cloud each reveal part of that path. None describes the whole release. Ammonia’s toxicity, interaction with moisture and possible liquid or aerosol phase make it especially important to distinguish a physical inventory from a measured gas concentration.
Start with the correct application boundary
MSC.1/Circ.1687, dated 26 February 2025, provides interim guidance for ships using ammonia as fuel and explicitly separates its scope from ships using ammonia cargo as fuel. It is goal-based guidance with a provisional character, not a declaration that every detailed design question has been settled. The actual statutory, Administration and class basis must be identified for the vessel and the particular installation.
This distinction matters when comparing a cargo carrier’s experience with a fuel installation on another ship type. The substance may be the same while tank location, piping exposure, occupied spaces, operating cycles and approval route differ. Public experience can inform a hazard assessment without automatically establishing equivalence. Define the fuel state, system boundary and operating mode before assessing what a protective measure can achieve.
Keep the health endpoint separate from fire properties
The NIOSH ammonia entry identifies the eyes, skin and respiratory system as target organs, includes liquid-contact and inhalation hazards, and warns that ammonia should be treated as flammable despite a transport-label distinction. Its listed lower explosive limit is 15% by volume. An absence of a flammable atmosphere therefore cannot be used as a general conclusion about health risk.
The same entry distinguishes time-weighted and short-term occupational values. Their duration, jurisdiction and purpose belong with them; this article does not turn them into universal shipboard alarm or entry settings. A person’s potential exposure also depends on location, time and contact route. A remote point reading cannot reconstruct all of those conditions, especially if a release changes rapidly.
Do not predict the whole cloud from pure-gas density
A pure ammonia gas property is not the density of every possible release cloud. The open research by Skarsvåg, Fyhn and Aasen examines how ammonia–water fog, phase equilibrium and heat released by mixing influence dispersion. Its discussion distinguishes cold evaporating releases from two-phase releases that can contain droplets. That is a reason to specify the release state, not a basis for assigning every cloud one direction of travel.
A useful release description includes pressure and temperature before release, liquid fraction, flashing assumptions, surrounding air, surfaces, wind or ventilation and obstacles. A calculation made for warm dry gas cannot silently represent a cold aerosol-laden jet. Equally, the presence of fog does not establish that the visible edge is the edge of the hazardous region. Visibility and concentration are different outputs of the physical process.
Translate gas units with an explicit thermodynamic basis
For a units example, use an ideal gas at 25°C and approximately one atmosphere, with molar volume 24.45 L/mol and ammonia molar mass 17.03 g/mol. A gas concentration of 100 ppm by volume corresponds to 100 × 17.03/24.45 = 69.65 mg/m³, approximately 69.7 mg/m³. This is a conversion of the same gas-phase concentration, not an exposure recommendation.
The conversion changes with pressure and temperature because molar volume changes. It also does not include droplets, liquid on surfaces or dissolved ammonia. A result reported as mg of nitrogen per cubic metre uses another mass basis and requires an additional molar-mass conversion. Record whether ppm means gas volume fraction and whether a mass result is expressed as NH₃ or as nitrogen before comparing measurements.
Use an average-concentration example to expose missing information
Assume, solely for bookkeeping, that a final 200 m³ gas volume contains 20.0 g of uniformly mixed gaseous ammonia at the same state. The average mass concentration is 100 mg/m³. Using the preceding molecular basis, this is approximately 143.6 ppm by volume. The arithmetic says nothing about how quickly that inventory arrived, whether it is still increasing or whether any local region is much more concentrated.
A compartment-average model can help check units or an overall material balance, but it does not locate an exposure boundary. A real compartment may contain obstructed pockets, extraction paths and occupied locations with different histories. It also may not be well mixed. A useful assessment identifies those unresolved spatial and temporal questions instead of presenting the average as a clearance certificate.
Treat a sensor reading as a bounded observation
A measurement needs a named target, range, calibration basis and response time. The sample path, installation position and environmental conditions are part of the observation, even when the display shows one precise number. A reading taken at a fixed point can support a statement about that point under the measurement conditions; extending it to another space or an earlier event requires further evidence.
For example, an instrument’s specified gas-phase response does not automatically quantify the mass of liquid aerosol in the same stream. Likewise, an unverified sample line can introduce transport or surface-interaction effects. These are reasons to examine the actual equipment evidence and test boundary. They do not justify inventing a correction factor from an unrelated sensor or treating a silent alarm as proof of complete containment.
Separate capture efficiency from harmless disposal
The release-mitigation provisions in MSC.1/Circ.1687 recognize that collected operational releases need a suitable handling path. Whatever technology is used, reducing ammonia in one outlet is not the same as destroying the substance or resolving the fate of collected material. Follow the gaseous discharge, retained inventory, liquid stream and any subsequent treatment as separate boundaries.
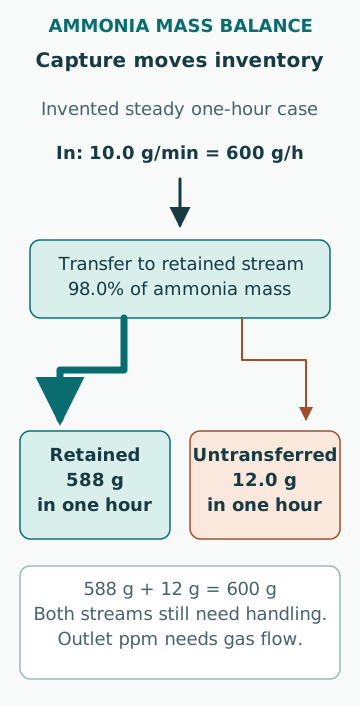
Consider an invented steady inlet carrying 10.0 g/min of ammonia and a hypothetical system transferring 98.0% to a retained stream on a consistent ammonia-mass-equivalent basis. The untransferred amount is 0.200 g/min, or 12.0 g/h; the retained amount is 588 g over one hour. A high percentage alone hides both quantities. This example specifies neither an acceptable discharge nor a design efficiency and does not predict outlet ppm without a gas-flow basis.
Follow ammonia after it reaches water
EPA’s aquatic-life ammonia explanation identifies direct toxicity to aquatic organisms and the importance of pH and temperature. Water therefore does not make an ammonia inventory disappear. Absorption may move material from a gas stream to an aqueous stream, changing the exposure and environmental questions while preserving the need to account for the material. Freshwater criteria cited by EPA are not adopted here as marine discharge limits.
If the preceding hypothetical 588 g were retained in a final 20.0 L liquid inventory, the average would be 29.4 g/L expressed as ammonia mass equivalent. This is a total inventory concentration, not a claim about the free dissolved NH₃ fraction or a disposal criterion. Chemical speciation, temperature, pH, mixing, other constituents and the actual treatment process must be considered before interpreting the hazard of that liquid.
Check barrier dependencies and restoration evidence
EMSA’s ammonia safety programme highlights toxicity, corrosiveness and the need to understand system boundaries and safety-system performance. A barrier assessment should consequently trace which services support containment, detection, ventilation, isolation and release handling. Shared power, cooling or control functions can connect failures that appear separate when only component names are listed.
The final evidence should identify the initiating condition, release path, occupied or environmentally exposed locations, measurement coverage and the functions that remain available in a degraded state. Common errors are assuming all ammonia rises, equating the visible cloud with the affected area, confusing a gas reading with total inventory, and equating capture with neutralization. A clear account of what is measured, what is inferred and what remains unknown is more useful than an unqualified claim that the system is protected.
Sources
- MSC.1/Circ.1687: Interim guidelines for ships using ammonia as fuel · IMO · Source check date: 2026-10-06
- NIOSH Pocket Guide: Ammonia · CDC / NIOSH · Source check date: 2026-10-06
- Influence of ammonia-water fog formation on ammonia dispersion from a liquid spill · Skarsvåg, Fyhn and Aasen / arXiv · Source check date: 2026-10-06
- Aquatic Life Criteria: Ammonia · US EPA · Source check date: 2026-10-06
- Safety of ammonia for use in ships · European Maritime Safety Agency · Source check date: 2026-10-06