Knowledge / Machinery and energy
Heat-exchanger fouling: separating thermal resistance from flow effects
Estimate duty, UA, effectiveness and an apparent fouling resistance while distinguishing changed flow, measurement error and actual surface degradation.
On this page
A warmer outlet or a larger pressure drop can suggest that a heat exchanger has changed, but neither observation alone identifies fouling. Flow, inlet temperatures, fluid properties, control-valve position and measurement error can produce similar symptoms. A more useful assessment first closes the heat balance, then compares thermal conductance and hydraulic behaviour on consistent operating bases. That sequence helps distinguish lost capability from a different duty imposed on healthy equipment.
Separate the physical mechanisms
NPTEL’s fouling discussion describes deposits as an additional thermal resistance and emphasizes the need for a retained clean reference. The deposit may also alter the available flow passage. Those thermal and hydraulic effects are related but are not identical measurements. A thin poorly conducting layer can affect heat transfer without causing the same relative change in pressure drop as a bulky obstruction.
Other mechanisms can reduce performance: air binding, bypass flow, uneven distribution, internal leakage or a change in the fluid’s viscosity. An assessment should therefore begin with competing explanations rather than equating all deterioration with scale. Establish the exchanger arrangement, connected streams, active area and actual operating state before assigning a fouling factor.
Close the two heat balances first
For a hypothetical steady liquid-to-liquid exchanger, let hot-side mass flow be 10.0 kg/s with constant specific heat 4.00 kJ/(kg·K), cooling from 80.0°C to 60.0°C. The hot-side heat loss is 800 kW. Let the cold stream be 20.0 kg/s with the same assumed specific heat, warming from 20.0°C to 30.0°C. Its heat gain is also 800 kW. The example assumes negligible external loss, storage and leakage.
Agreement is a useful consistency check, not proof that every instrument is correct; compensating errors can agree. Disagreement also does not uniquely diagnose an internal leak. Unsteady conditions, an unmeasured branch, wrong fluid properties or sensor bias can be responsible. Resolve the boundary and uncertainty before deriving a precise conductance from inconsistent heat duties.
Calculate conductance using the actual flow arrangement
The DOE heat-transfer handbook explains log-mean temperature difference for heat exchangers. For ideal counterflow in the preceding example, the end differences are 80 − 30 = 50 K and 60 − 20 = 40 K. The logarithmic mean is (50 − 40)/ln(50/40), approximately 44.81 K. With correction factor equal to one for this ideal arrangement, UA = 800/44.81 = 17.85 kW/K.
If the defined heat-transfer area is 20.0 m² on the same area basis, U is about 893 W/(m²·K). This value belongs to the assumed condition and model. A multipass or crossflow installation may require a different relation or correction factor. Using the correct four temperatures with the wrong flow model can still produce an incorrect U. When both end differences are equal, use the mathematical limit rather than treating the resulting zero-over-zero expression as zero heat transfer.
Distinguish effectiveness from a condition score
NPTEL’s effectiveness explanation compares actual transfer with the maximum possible transfer for the specified inlet conditions and heat-capacity rates. In this example, the smaller capacity rate is 40.0 kW/K, and the inlet temperature difference is 60.0 K. The ideal maximum is therefore 2,400 kW; effectiveness is 800/2,400 = 0.333, or 33.3%.
This does not mean that two thirds of a rated capacity has been lost or that the unit is thirty-three percent healthy. Effectiveness is tied to flow arrangement, capacity-rate ratio and UA relative to the smaller capacity rate. A clean exchanger can have this value by design. Comparing effectiveness across changed flows without a model can therefore confuse a normal operating change with degradation.
Infer an apparent added resistance carefully
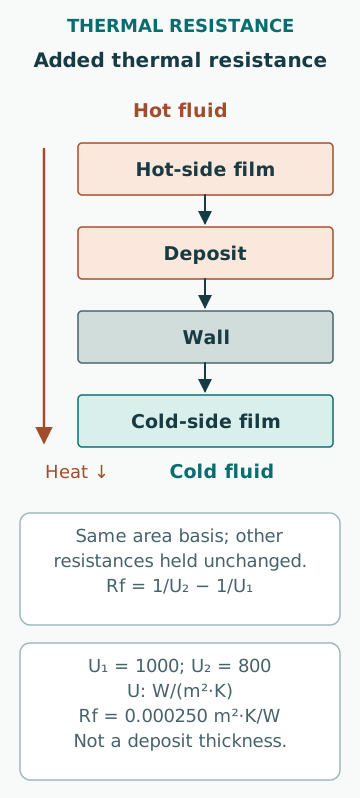
In a separate matched-condition example, suppose the clean overall coefficient is 1,000 W/(m²·K) and the later value is 800 W/(m²·K), both on the same area basis. If other resistances truly remain unchanged, the inferred added resistance is Rf = 1/800 − 1/1,000 = 0.000250 m²·K/W. This is the difference of reciprocals, not the reciprocal of the difference in coefficients.
Calling that value a deposit resistance requires the assumption to be justified. If convection changed because the flow or viscosity changed, part of the difference may belong to the fluid film instead. The value also does not reveal chemical composition or deposit thickness by itself. Converting resistance to thickness would require a suitable conductivity and geometric model, neither of which can be obtained from U alone.
Normalize hydraulic observations before calling them blockage
For an isolated sensitivity example, approximate a fixed turbulent-flow passage by Δp proportional to volumetric flow squared, with density and effective resistance coefficient unchanged. A 20% flow increase multiplies pressure drop by 1.20² = 1.44. An initial 50.0 kPa would become 72.0 kPa even without new blockage. This is a local model assumption; real friction factor, viscosity and flow distribution may change.
Conversely, a flow reduction can conceal growing resistance in the raw pressure-drop trend. Compare pressure taps, flow, temperature and valve arrangement on both dates. A pump’s discharge pressure is not the same as the exchanger’s differential pressure. If one pressure tap includes a strainer or valve while another comparison does not, the apparent exchanger change may belong to a different component.
Keep measurement uncertainty in the conclusion
A small temperature difference can be especially sensitive to sensor error. In a separate example, suppose two temperature measurements each have a bounded error of ±0.2 K. Their difference can have a worst-case error of ±0.4 K if the errors oppose. For a measured rise of 2.0 K, that bound alone is 20% of the temperature-difference value, before flow and specific-heat uncertainty are included.
This is a worst-case interval illustration, not a standard deviation or a confidence interval. Independent random uncertainties would be combined differently, and common bias may partly cancel in a difference. State which interpretation applies. Reporting a UA decline of a few percent as confirmed fouling would be unjustified if the underlying measurement uncertainty could explain it.
Use the pattern and timing to test alternatives
Alfa Laval’s troubleshooting discussion distinguishes cyclic, gradual and sudden performance changes and asks users to compare actual conditions with the design basis. These patterns help frame hypotheses: a seasonal change can track the heat sink, a sudden change can follow a flow-path event, and a gradual trend can be consistent with accumulation. None of those patterns alone proves a cause.
A representative Alfa Laval shell-and-tube manual also notes that air or vapour binding should be considered when thermal performance falls. The lesson is to check competing mechanisms before selecting maintenance. A before/after cleaning comparison is strongest when the same measurements, flow basis and fluid conditions are retained. A changed plate arrangement or bypass position can otherwise obscure what the cleaning achieved.
Separate thermal recovery from mechanical integrity
Improved heat transfer after maintenance does not demonstrate freedom from internal leakage, correct gasket installation or adequate pressure integrity. Those functions require their own evidence. Likewise, an apparent low fouling resistance does not establish that a thin wall is structurally acceptable. Thermal, hydraulic and integrity assessments overlap but answer different questions.
Common mistakes are using outlet temperature as a standalone condition score, mixing area bases for U, omitting the flow-arrangement correction, attributing every pressure increase to blockage, and reporting small trends without uncertainty. A useful conclusion gives the matched operating basis, heat-balance residual, inferred conductance, hydraulic evidence and unresolved mechanisms. Cleaning chemistry, opening and pressure testing remain governed by the equipment-specific approved procedure.
Sources
- Heat Exchangers,Module8Lecture34§8.2.2 · NPTEL · Source check date: 2026-10-06
- DOE-HDBK-1012/2-92:Heat Transfer · US DOE · Source check date: 2026-10-06
- Heat Exchangers,Module8Lecture36§8.2.8 · NPTEL · Source check date: 2026-10-06
- Troubleshooting for plate heat exchangers · Alfa Laval · Source check date: 2026-10-06
- Alfa Laval Pharma-line instruction manual · Alfa Laval · Source check date: 2026-10-06