Knowledge / Machinery and energy
Marine reverse osmosis: net driving pressure and salt rejection
Distinguish pressure, recovery and rejection with a worked seawater balance, then interpret normalized flow, concentration polarization and membrane condition without relying on one gauge.
On this page
A marine reverse-osmosis unit separates a feed stream into lower-salinity permeate and a more concentrated reject stream. Its high-pressure pump supplies a driving force, but pump pressure alone does not determine production. Osmotic pressure, pressure losses, permeate backpressure, temperature and membrane condition all contribute. A useful assessment keeps the water balance, salt balance and membrane-driving force separate before relating them to the observed output.
Follow the feed, permeate and concentrate
DuPont’s reverse-osmosis overview describes crossflow through the membrane element: part of the feed crosses as permeate, while concentrate carries rejected material along the feed side. This is different from a dead-end filter that simply retains all rejected material until cleaning. The concentrate stream is part of the process, not an accidental loss that can always be reduced without consequence.
Label the measurement boundaries. Feed to the plant, feed to one stage and recirculated feed to an element may be different flows. A recovery value needs to state which of them forms its denominator. Likewise, a product sample taken after blending or a storage tank does not directly represent a single membrane element. These distinctions become important when a system appears to meet its overall production target while one part operates differently from the rest.
Separate recovery from salt rejection
Recovery is the permeate-flow fraction of the relevant feed. Salt rejection describes the reduction in a defined salt concentration across a stated comparison. DuPont’s RO-principles excerpt treats recovery and feed salinity as separate influences on performance. A high recovery does not mean a high rejection, and a high rejection does not mean that most of the incoming water has become product.
For a simple system-level comparison, apparent rejection can be written R = 1 − Cp/Cf, where Cp and Cf use the same concentration basis and represent comparable permeate and feed conditions. Salt passage is the complementary fraction Cp/Cf. The formula does not imply equal rejection of every ion or molecule. Name the measured quantity, sample location and method rather than reporting an unexplained percentage.
Work a water and salt balance
Assume a hypothetical steady plant receives 2.00 m³/h at salt concentration 35.0 kg/m³ and produces 0.800 m³/h permeate at 0.175 kg/m³. For this approximate example, neglect volume-of-mixing and storage effects so concentrate flow is 1.200 m³/h. Water recovery by volume is 40.0%. The apparent concentration rejection is 1 − 0.175/35.0 = 99.5%. The two percentages answer different questions.
Incoming salt flow is 2.00 × 35.0 = 70.0 kg/h. Permeate carries 0.800 × 0.175 = 0.140 kg/h. The concentrate therefore carries 69.86 kg/h, giving 69.86/1.200 = 58.22 kg/m³. These are invented inputs for a balance, not a target recovery or product-water acceptance criterion. If instrument values fail to close the balance, check units, sampling times, temperature compensation, recirculation and storage before assuming membrane damage.
Calculate net driving pressure at the membrane
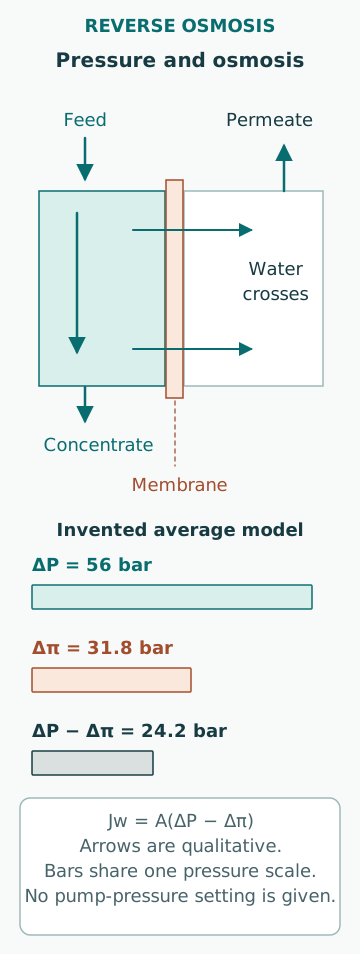
A simplified water-flux relation is Jw = A(ΔP − Δπ), where ΔP is the hydraulic pressure difference across the membrane, Δπ the osmotic-pressure difference and A an appropriate water-permeability coefficient. The pressure at the high-pressure pump discharge is not necessarily the average feed-side pressure along the membrane. Feed-channel losses reduce it, while the concentrate becomes more saline along the path.
In a separate illustrative calculation, inlet and concentrate-end pressures are 60 and 56 bar, permeate pressure is 2 bar, and a simple average feed-side pressure is 58 bar. Assume representative feed-side osmotic pressure 32 bar and permeate osmotic pressure 0.2 bar. Hydraulic difference is 56 bar, osmotic difference 31.8 bar, and net driving pressure is 24.2 bar. This average model omits spatial variation and concentration polarization; it is not an element-design calculation.
Use a sensitivity example without prescribing pump pressure
Suppose, only for illustration, A = 1.00 L/(m²·h·bar) and active area is 40.0 m² under the assumed condition. The preceding net driving pressure gives 968 L/h, or 0.968 m³/h. If representative feed-side osmotic pressure rises by 4 bar while all other assumed quantities remain unchanged, net driving pressure becomes 20.2 bar and the simple flow estimate becomes 808 L/h. That is a 16.5% reduction despite unchanged hydraulic pressures.
The two scenarios are arithmetic sensitivities, not verified membrane performance or a recommended compensation strategy. Increasing feed pressure may change flux, recovery, fouling behaviour and mechanical demand; allowable element, vessel and pump limits still apply. A plant does not become correctly operated merely because pressure is increased until an old flow number returns.
Understand why the membrane surface can differ from the bulk
As water crosses the membrane and dissolved material is rejected, the concentration close to the feed-side surface can exceed the bulk-stream value. This concentration polarization increases the local osmotic opposition and can favour deposition under the relevant chemistry. A bulk feed sample does not directly measure that surface state. Crossflow and mass transfer influence the difference, so recovery, flow distribution and membrane condition interact.
Concentration polarization is not identical to irreversible fouling. Some performance effects can change with operating conditions, while deposited scale, particulates, biological growth or chemical damage involve other mechanisms and responses. A useful diagnosis separates reversible operating effects from persistent condition changes instead of grouping every production loss under “dirty membranes.”
Normalize a trend before calling it degradation
The August 2026 FilmTec technical manual explains normalization against reference conditions to distinguish operating changes from performance deterioration. It also identifies oxidation as a membrane-protection concern in its pretreatment discussion. These are separate diagnostic issues; neither a raw flow trend nor a generic cleaning response resolves them. The relevant passages were used as manufacturer guidance, not as a substitute for the installed plant’s operating manual.
Compare feed temperature, composition, pressure, recovery and permeate backpressure before interpreting changes in output. The normalization method and reference state should remain consistent and documented. A normalized result is still a model based on measurements: biased flow meters, an incorrect conductivity conversion or a missing pressure loss can create a misleading trend. Retain raw readings so a later correction can be traced.
Use pressure drop and quality together
A rising feed-channel differential pressure at comparable flow can support a restriction hypothesis, but a different flow rate can change that pressure drop without the same condition change. Higher salt passage can arise from several causes, including damaged elements, seals, changed operating conditions or sample problems. A single pattern is a clue, not a unique fault signature. Separate plant-level evidence from the evidence needed to locate an affected stage or element.
Pretreatment, chemical compatibility and shutdown preservation also belong to the system boundary. A membrane may meet one pressure rating while being unsuitable for a particular chemical exposure. No chemical dose, cleaning mixture or exposure allowance follows from this article. Any cleaning or preservation decision must follow the actual membrane and plant instructions, with a clear account of what contaminant or condition is being addressed.
Keep product acceptance separate from one performance metric
A calculated 99.5% rejection means the stated concentration ratio under the stated conditions. It does not certify drinking-water safety, boiler-water suitability or removal of every contaminant. Those uses have their own quality controls, post-treatment and storage requirements. Even a correctly operating membrane does not prove that a downstream tank, blend or distribution line preserves the required quality.
A useful final record includes the flow boundary, feed/permeate/concentrate measurements, pressure locations, temperature, concentration method, reference normalization and relevant operating changes. The conclusion should identify whether the observation is explained by the balance, driving force, transport conditions or evidence of damage. Keeping these questions distinct turns a collection of gauge readings into a defensible assessment of the complete RO process.
Sources
- Reverse Osmosis · DuPont Water Solutions · Source check date: 2026-10-06
- Principle of Reverse Osmosis and Nanofiltration, 45-D01538-en Rev 10 · DuPont Water Solutions · Source check date: 2026-10-06
- FilmTec Reverse Osmosis Membranes Technical Manual, 45-D01504-en Rev 20 · DuPont Water Solutions · Source check date: 2026-10-06