Knowledge / Machinery and energy
Ship sewage treatment: hydraulic loading, organic loading and treatment evidence
Separate wastewater volume from oxygen-demand loading, compare water and solids retention times and use clear mass balances to interpret plant capacity, dilution and effluent evidence.
On this page
A sewage treatment plant has to handle both the amount of water entering it and the material carried in that water. Those demands do not always rise together. More flushing water can increase hydraulic load without increasing the organic load by the same proportion; more concentrated waste can do the reverse. Understanding this distinction helps explain why a plant can be within its nominal daily volume yet struggle, or why a lower effluent concentration does not necessarily mean more treatment occurred.
Define the streams before naming the plant capacity
IMO’s sewage overview places ship equipment, discharge control, surveys and certification within MARPOL Annex IV. Applicability and discharge conditions depend on the ship and location. An approved plant is not a general permission to discharge anywhere. For technical interpretation, first identify the streams the installed plant is approved and designed to receive, including any greywater or process-water connections.
Toilet wastewater, laundry discharge, galley streams, cleaning chemicals and seawater flushing can have different hydraulic and chemical effects. A drawing that labels all of them simply “sewage” may hide the cause of a disturbance. Record which streams join before the inlet flow measurement and sample point, and which join later. That boundary determines what the measured influent actually represents.
Separate concentration from daily loading
Concentration describes material or a test response per unit volume. Loading combines concentration with flow over time. Biochemical oxygen demand, BOD₅, is a defined five-day test quantity associated with oxygen consumption under its test conditions; it is not simply the mass of all organic matter. Chemical oxygen demand, suspended solids and nutrient measurements answer other questions. A single clear-water appearance cannot replace those measurements.
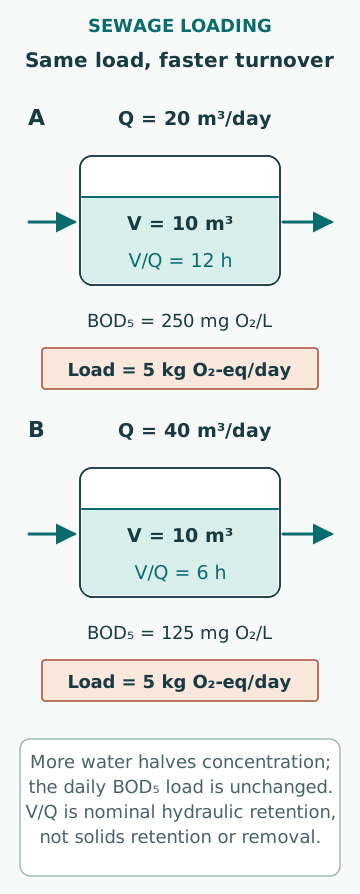
For an invented influent of 20.0 m³/day with BOD₅ of 250 mg O₂/L, the daily BOD₅ load is 20,000 L/day × 250 mg O₂/L = 5.00 kg O₂-equivalent/day. The conversion from milligrams to kilograms is essential. Saying only “250” or only “20 cubic metres” omits half of the loading calculation and makes comparison with another operating day ambiguous.
See how a volume increase can leave the organic load unchanged
Suppose the same 5.00 kg O₂-equivalent/day enters with 40.0 m³/day because additional relatively clean water is included. The corresponding concentration is 125 mg O₂/L. The concentration has halved, but the organic-test load has not. The hydraulic load has doubled. Depending on the plant, this can change residence time, pumping, separation and the capacity available for peak flows. It is not automatically easier treatment.
In a different scenario, keep flow at 20.0 m³/day but double BOD₅ to 500 mg O₂/L. The load becomes 10.0 kg O₂-equivalent/day. The water volume is unchanged while the biological demand increases. These two cases show why a capacity comparison must retain both hydraulic and organic bases, together with the relevant characteristics of the waste.
Calculate hydraulic retention without mistaking it for sludge age
For a simplified well-mixed liquid volume of 10.0 m³ and net feed of 20.0 m³/day, nominal hydraulic retention time V/Q is 0.50 day, or 12 hours. At 40.0 m³/day it is 6 hours. These averages do not describe every parcel’s residence time, and a recirculation flow should not silently replace the defined net-feed denominator. Dead zones, bypassing and changing liquid level can alter the actual residence-time distribution.
The US EPA treatment-technology discussion treats hydraulic detention, solids retention and organic loading as distinct process variables. If a hypothetical system contains 30 kg of the tracked suspended solids and loses 2 kg/day through all external solids-loss paths, its inventory-to-loss solids retention time is 15 days. That number can coexist with a 12-hour hydraulic retention time. It is a bookkeeping illustration, not a recommended sludge age or proof that all retained solids are active organisms.
Identify what the biological and separation stages each do
Biological treatment uses an appropriate microbial community to transform biodegradable material under controlled conditions. The Evac moving-bed example describes biomass supported on carriers, followed by further treatment for solids and microorganism removal. It is one published marine architecture; suspended-growth and membrane-based systems use other arrangements. The brand’s approval claim does not establish the status of an unrelated installed plant.
Biological conversion and solids separation are different functions. A separator can retain suspended matter without completing the intended biological conversion, while a biologically active tank can still release excessive solids if the downstream stage fails. Dissolved constituents and nutrient transformations need the relevant process conditions. A membrane or clear outlet does not automatically demonstrate every required treatment function.
Read aeration and operating condition as evidence
An air blower running is not the same as adequate oxygen transfer to the process. Air distribution, diffuser condition, mixing, liquid properties and oxygen demand affect the result. Similarly, a dissolved-oxygen value at one point may not represent the whole tank. A useful assessment relates the reading to location, instrument condition, load and the design’s intended aerobic or other process zones.
Temperature, salinity, pH, toxic inputs and sudden loading changes can disturb biological performance. The response time of the biomass is different from the response time of a pump or valve. A change in discharge quality immediately after a flow event and a sustained change after a chemical input may require different explanations. Generic teaching does not provide a chemical dose or a recovery procedure for an actual plant.
Demonstrate why dilution is not treatment
Assume the original 20.0 m³/day feed contains 5.00 kg/day of BOD₅ load and the plant reduces that load by an illustrative 80%. The remaining load is 1.00 kg/day. If effluent flow is also 20.0 m³/day, its corresponding concentration is 50.0 mg O₂/L. If an additional 20.0 m³/day of zero-BOD water were mixed in after treatment, the concentration would become 25.0 mg O₂/L, but the remaining load would still be 1.00 kg/day.
These numbers do not represent an applicable effluent standard or an approved test method. They show why concentration, flow and sampling boundary must be assessed together. The definitions in MEPC.227(64) explicitly distinguish influent, effluent, hydraulic loading and water introduced as dilution after the influent measurement point. A lower sample concentration produced by added water is not evidence that the biological stage removed more material.
Interpret certification and ongoing performance separately
Type approval concerns the equipment and the defined test/approval basis. Ongoing performance concerns what the installed plant does under actual loading, maintenance and operating conditions. A certificate cannot establish that an aerator is functioning today, that a bypass is correctly configured or that the current sample represents the discharge. Conversely, an apparently favourable spot sample cannot by itself demonstrate compliance with every condition of the approval.
Use the certificate, operating manual and applicable requirements to establish the correct capacity and performance basis. Installation date, plant arrangement and operating area can affect which provisions matter. The numerical examples here intentionally avoid giving a universal discharge distance, concentration limit or sampling interval. Those values must be checked against the actual ship’s applicable framework, including relevant local restrictions.
Build a record that can explain a deterioration
A useful operating record includes persons served or another relevant loading basis, net influent flow, identified input streams, representative test results, temperature, process-condition measurements, solids-removal history and observed equipment state. Record peak events as well as daily averages. A short peak can challenge pumping or separation even when the daily total remains ordinary.
When quality changes, ask whether hydraulic load, oxygen-demand load, solids retention, treatment condition or a bypass changed first. Reconcile the sample boundary and flow balance before assigning a biological fault. The conclusion should connect the evidence to a specific process function and state what remains uncertain. This turns a nominal plant capacity into an interpretable operating envelope rather than a single reassuring number.
Sources
- Prevention of Pollution by Sewage from Ships · International Maritime Organization · Source check date: 2026-10-06
- Development Document for Centralized Waste Treatment Category, 2000 · US Environmental Protection Agency · Source check date: 2026-10-06
- Evac EcoOcean MBBR · Evac · Source check date: 2026-10-06
- MEPC.227(64), 2012 Guidelines on effluent standards and performance tests for sewage treatment plants · International Maritime Organization · Source check date: 2026-10-06