Turbocharger compressor surge: operating maps and transient causes
Author: Yönetici · Editorial date: (user-assigned)
Read a compressor operating point with the correct pressure and flow references, distinguish steady margin from transient stability and use a worked uncertainty example to question apparent headroom.
On this page
Compressor surge is a system instability, not simply a synonym for a noisy turbocharger. A compressor, its inlet and discharge paths, the air receiver and the engine interact. The same turbocharger can behave differently when flow resistance, engine demand or the speed of a load change alters that interaction. A compressor map helps explain the available operating region, but it is useful only when its axes, reference conditions and limits are understood.
Describe the instability before naming the cause
During surge, the compressor–system combination develops unstable pressure and flow behaviour; severe events can include reversal of flow. Accelleron’s surge explanation relates the phenomenon to restrictions, engine-system faults and rapid load changes. It also identifies the surge boundary on a compressor map. This supports a system-level interpretation: the compressor can be affected by conditions elsewhere in the air and exhaust paths.
An unusual sound alone does not identify surge or its root cause. Mechanical vibration, unstable combustion and other faults can also be audible. Preserve the timing of noise, pressure changes, speed changes and engine events. A repeated coincidence is useful evidence, while a single observation may only establish that something abnormal occurred. Do not use a descriptive label to close the investigation before the physical sequence is understood.
Read the map axes and operating boundary
A map commonly plots pressure ratio against a flow variable, with speed lines and efficiency contours. MIT’s turbocharging lecture includes the conceptual relationship between the operating region and surge boundary. Actual maps differ: flow may be mass flow, inlet volume flow or a corrected quantity, and pressure ratio may use specified total or static conditions. Read the supplied definition rather than assuming that every chart shares the same axes.
A point inside an efficiency island is not automatically acceptable if another speed, temperature or mechanical constraint is exceeded. Likewise, a point to the apparent stable side of a line may provide inadequate allowance for uncertainty and transient movement. The surge line is associated with the tested or modelled configuration and gas conditions. It is not a universal limit obtained by drawing one curve through unrelated engine data.
Keep absolute pressure and measurement stations explicit
Suppose compressor inlet total pressure is 95 kPa absolute and discharge total pressure is 285 kPa absolute. The total-to-total pressure ratio is 3.00. If inlet pressure became 90 kPa while discharge pressure remained 285 kPa, the ratio would be 3.17. This is a conditional arithmetic comparison, not a prediction that discharge pressure will actually stay constant. It shows why an inlet restriction cannot be evaluated only by reading the downstream receiver gauge.
Gauge pressures cannot be divided to obtain this ratio. Nor should a receiver static pressure after a cooler silently replace compressor-discharge total pressure. Losses and velocity changes separate those stations. A practical data record identifies pressure type, sensor location and units, then uses the relationship required by the particular map. If a needed quantity is estimated rather than measured, label that estimate and its uncertainty.
Normalize flow only with the stated convention
One common corrected-flow convention is , using absolute temperature and the applicable total pressure. NASA’s Wind-US documentation states this normalization for its specified boundary station. The same mathematical form can be used for a compressor inlet when that map defines it there; the station and reference values must match. Do not import NASA’s numerical reference conditions into a manufacturer map that uses different ones.
For an invented inlet example, take actual mass flow 12.0 kg/s, , , and . The corrected flow is approximately 13.45 kg/s. This does not mean that an extra 1.45 kg/s of air physically appeared. It is a normalized coordinate used for comparison. Mixing 12.0 actual kg/s with a surge line expressed in corrected kg/s would create a false margin.
Define a margin before calculating its percentage
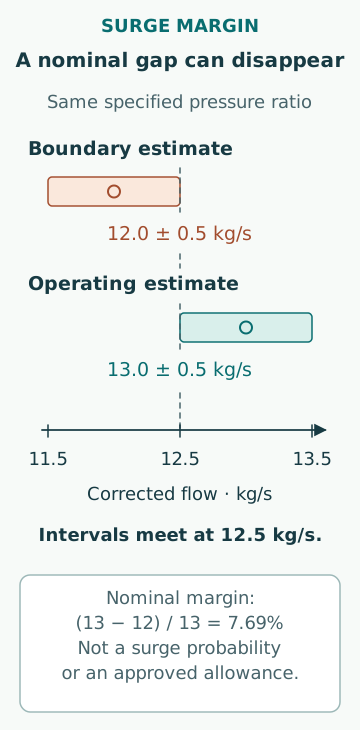
Consider an entirely hypothetical map slice at the same specified pressure ratio. The operating corrected flow is 13.0 kg/s and the corresponding surge-boundary flow is 12.0 kg/s. If a chosen horizontal margin is defined as (operating flow − surge flow)/operating flow, the result is 7.69%. A definition with surge flow in the denominator would give 8.33%. Neither is inherently the one required by every manufacturer; the stated definition controls the number.
This distance is not a probability of surge, a certified operating allowance or a substitute for the maker’s margin convention. Suppose the operating-flow estimate and the boundary location each have an illustrative uncertainty band of ±0.5 kg/s. Their nearest edges meet at 12.5 kg/s, so the nominal 1 kg/s mass-flow gap does not prove positive separation under those bounds. These are simple worst-case intervals, not statistical confidence limits. Correlation and the quality of each estimate would matter in a fuller uncertainty analysis.
Explain why a steady point cannot capture every transient
A receiver contains compressed gas, the rotor has inertia and the engine’s air demand changes with its operating state. These quantities do not necessarily adjust at the same rate. During a rapid load change, the path through pressure, flow and speed can differ from the line formed by stabilized measurements. A map point averaged over several seconds can therefore miss the excursion that matters. Sampling rate and time alignment belong in the evidence.
The useful dynamic question is what moved first, how quickly the other variables responded and whether the system crossed a relevant boundary during that interval. An average point collected before and after an event cannot answer that question alone. Record whether control valves, auxiliary air arrangements or operating modes changed at the same time. Their intended effects must be assessed in the actual engine–turbocharger combination.
Treat fouling as a change to the complete flow path
Accelleron’s compressor-maintenance article links contamination to degraded compressor performance and, in severe cases, surging. It also describes exhaust leakage contaminating the inlet environment. This is a concrete reason to look beyond the visible compressor wheel. Intake restriction and changed surface condition can coexist, and restoring one symptom may not restore the original performance.
Compare trends at matched load and ambient conditions: inlet pressure loss, receiver pressure, compressor temperatures, turbocharger speed and exhaust temperatures can help locate what changed. No single trend uniquely proves fouling. A pressure difference can rise because flow rose, and temperature can rise because inlet conditions changed. A maintenance finding is strongest when physical inspection and repeatable performance evidence agree within the appropriate equipment limits.
Keep different control functions distinct
A charge-air bypass, an exhaust wastegate and a compressor recirculation arrangement do not perform identical functions. The MAN 32/40 project guide describes a particular charge-air bypass used under defined conditions and notes its role in avoiding surge. That example establishes that engine integration can include purpose-specific provisions; it does not establish a generic valve position or sequence for another vessel.
A recorded command is also different from demonstrated movement and the intended aerodynamic effect. An analysis should distinguish the controller request, actuator state, physical valve position and resulting pressure/flow response. If those observations disagree, the disagreement is itself evidence. Ad hoc bypassing or tuning cannot be justified by a simple map sketch, and any intervention must follow the applicable engine and turbocharger instructions.
Write a conclusion that the evidence can support
A useful event record identifies the turbocharger configuration, map revision, operating mode, load history, reference conditions, sensor locations and relevant maintenance changes. Keep fast event data separate from stabilized trend points. State which values were measured, calculated or assumed, and whether the observation establishes surge, a possible approach to the boundary or only an unexplained disturbance.
The strongest conclusion links a specific physical change to a repeatable response and shows that corrective work restored the required behaviour within the approved envelope. The absence of further noise during a short run does not prove the original margin has returned. The worked examples in this article explain coordinate choice and uncertainty; they are not operating limits or a procedure for testing how close a turbocharger can run to surge.
Sources
- Fundamentals of turbocharging: What is surging, and how does it impact your turbocharger? · Accelleron · Source check date: 2026-10-06
- Lecture 20: Turbocharging · MIT OpenCourseWare, Wai Cheng · Source check date: 2026-10-06
- Wind-US user guide: MASS FLOW · NASA Glenn Research Center · Source check date: 2026-10-06
- How to maintain your turbocharger’s compressor stage · Accelleron · Source check date: 2026-10-06
- MAN 32/40 IMO Tier II project guide, marine · MAN Energy Solutions · Source check date: 2026-10-06