Knowledge / Decision analysis
Weighted MOORA ratio system: separating benefits from costs
Author: Yönetici · Published:
Open the working calculator · Decision analysis
MOORA compares alternatives using dimensionless ratios derived from criterion values. This page implements only its weighted ratio-system component: add weighted benefit contributions and subtract weighted cost contributions. It does not calculate the reference-point component, and its output must not be described as MULTIMOORA. Naming the scope matters because these related approaches perform different calculations.
Brauers and Zavadskas describe the ratio system and reference-point approach separately. Their 2009 paper also explicitly introduces significance coefficients for weighting the ratio system. The linked calculator makes that particular calculation inspectable. It does not reproduce every component or methodological claim of the broader framework.
Normalize within each criterion
One column might contain prices, another quality ratings. Adding their raw values would allow the numerical size of their units to influence the decision. The ratio system divides each value by the square root of the sum of squared values in its column. This is a Euclidean or vector norm. Calculate it across alternatives for the same criterion, not across unlike criteria within an alternative's row.
Let x_ij be alternative i's value on criterion j. Define D_j = √(Σ_i x_ij²) and r_ij = x_ij/D_j. Use nonnegative weights normalized to sum to one. If B contains benefit criteria and C contains cost criteria, calculate y_i = Σ_(j∈B) w_j r_ij − Σ_(j∈C) w_j r_ij. Rank from largest to smallest y_i. A cost criterion is not reciprocated before this operation: its normalized contribution is subtracted.
Work through three alternatives
Use cost, quality and support with weights 0.40, 0.35 and 0.25. A has values (100,80,6), B has (120,90,8), and C has (90,70,5). The first criterion is minimized; the other two are maximized. Their vector norms are √32500 ≈ 180.277564, √19400 ≈ 139.283883, and √125 ≈ 11.180340.
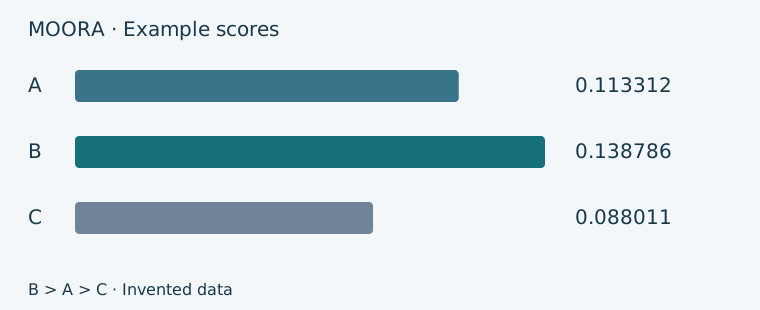
The normalized rows are approximately A = (0.554700,0.574367,0.536656), B = (0.665640,0.646162,0.715542), and C = (0.499230,0.502571,0.447214). For A, the calculation is −0.40×0.554700 + 0.35×0.574367 + 0.25×0.536656 ≈ 0.113312. B scores 0.138786 and C scores 0.088011, producing B > A > C.
B's cost contribution is approximately −0.266256, while its combined benefit contribution is 0.405042. Keeping these components visible explains the result better than showing a single opaque number. A positive score does not independently mean “good,” and a negative score does not independently mean “bad.” If every score is negative, the highest, least negative score is still preferred by this model.
Valid inputs and degeneracies
Finite real-valued data are mathematically usable, including individual zeros and negative values. Their practical interpretation still matters: a profit criterion may legitimately contain losses and remain a benefit criterion. An all-zero column has a zero norm. The proposed calculator convention assigns zero contribution to that column and displays a warning. A nonzero constant column is defined and gives everyone an equal contribution, affecting score levels but not the ordering. Removing it silently would obscure how the displayed scores were calculated.
Do not convert missing cells into zeros. Zero is a measured value; missingness is absence of information. Reject negative weights, an all-zero weight vector, and nonfinite inputs. If all positively weighted columns are constant, alternatives tie. Use full-precision results for ranking, with a declared numerical tolerance if near-equality is treated as a tie, rather than inferring equality from rounded display values.
Sensitivity that matters in practice
Multiplying an entire column by a positive constant leaves its ratios unchanged. Adding the same constant to all entries generally does not: it changes the norm and can alter trade-offs. Consequently, scales related by an offset, such as Celsius and Kelvin, require care. Adding or removing alternatives also changes column norms and can affect the order of existing alternatives. These conclusions follow directly from the stated formula.
Weights do not tell the complete story of influence. The distribution of values within each criterion determines the size of normalized differences. A criterion with little variation can provide only small distinctions even when its weight is substantial. Test plausible weight changes, measurement uncertainty and alternative-set scenarios, particularly when the leading scores are close. Apply hard eligibility requirements separately; weighted compensation should not override a mandatory constraint.
Use the calculator's benefit total, cost total and net score together. They help identify which assumptions make an option attractive. The resulting score is neither a probability nor a percentage of an ideal solution, and agreement with another method on one example does not establish universal superiority.
Source: Brauers, W. K., & Zavadskas, E. K. (2009). Robustness of the multi-objective MOORA method with a test for the facilities sector. Technological and Economic Development of Economy, 15(2), 352–375. https://doi.org/10.3846/1392-8619.2009.15.352-375 (sections 3.1 and 3.3).
Declared implementation rules
The calculator on this site accepts nonnegative data within a bounded teaching scope; nonzero values lie between 10⁻⁹ and 10⁹. Although the SAW formula supports a wider real-number domain, this interface does not accept negative observations. EDAS requires every value to be strictly positive. Weights must be zero or between 10⁻⁹ and 10⁶, with a positive total.
Test the example yourself
Recalculate with different matrix values and weights. Read the intermediate values alongside the sensitivity table.