Knowledge / Maintenance and reliability
Lubricant varnish: solubility, temperature changes and surface deposits
Follow degradation material between oil and surfaces, calculate a bounded inventory and cleanup balance, and explain why a low particle count or one MPC result cannot prove a clean system.
On this page
Lubricant varnish is a deposit problem with a changing fluid phase. Some degradation material can remain dissolved, some can be suspended, and some can adhere to the machine. A sample taken from warm circulating oil therefore does not necessarily represent a cold control passage or the material already attached to a valve. Understanding those separate inventories is more useful than treating varnish as ordinary wear particles caught by a finer screen.
Formation and deposition are two different steps
Chemical degradation generates a mixture of products whose behaviour depends on the oil, additives and operating history. Formation of those products is not the same event as their deposition. A material may circulate in an oil-compatible form before a change in condition favours separation or adhesion. Conversely, deposits can remain on a surface after the sampled fluid appears improved.
Pall describes varnish material with limited solvency and deposition in colder control regions. A servo valve can be affected by a small local inventory that is insignificant compared with the reservoir’s total oil mass. Location and mechanical sensitivity matter as well as the amount of material. The precise chemical mixture and equilibrium are oil-specific, so there is no universal varnish solubility curve.
Hot spots can generate material that deposits somewhere cooler
A high-temperature zone can accelerate degradation while a cooler, low-flow region favours deposition of some resulting material. These are compatible mechanisms, not contradictory temperature advice. Raising the entire oil temperature to keep material dissolved would not remove it and may worsen another degradation or equipment constraint.
Temperature history also matters for the sample. Cooling, storage time, mixing and the prescribed laboratory conditioning can change which material is presented to a measurement. Compare trends with a consistent sampling point and method. A warmer sample and a cooler sample can differ because of phase behaviour even if the system’s total degradation inventory has not changed.
Worked inventory: a hypothetical solubility change
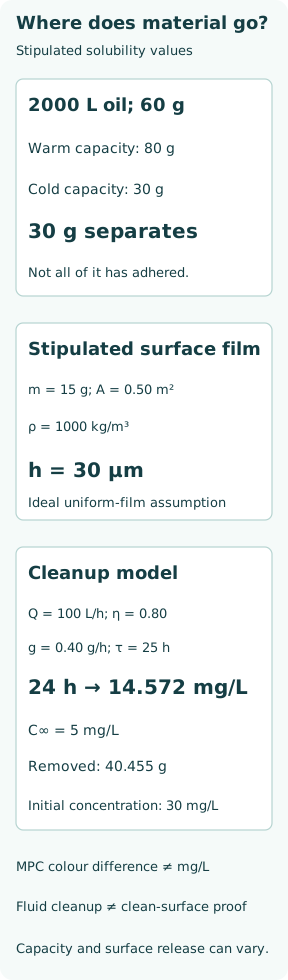
Use an explicitly simplified single-pseudocomponent model with 2000 L of oil and 60 g of relevant material, equivalent to 30 mg/L total inventory. Stipulate a warm solubility of 40 mg/L and a cold solubility of 15 mg/L. These are invented teaching values, not measured properties of a commercial lubricant. Assume instantaneous equilibrium and constant oil volume only for this calculation.
The warm dissolved capacity is 2000 × 40/1000 = 80 g, enough to accommodate the 60 g inventory. The cold capacity is 2000 × 15/1000 = 30 g, leaving 30 g outside the dissolved pool. “Outside solution” does not mean all 30 g immediately coats a valve: suspension, surface affinity, nucleation and time determine where it goes.
A small mass can imply an appreciable film in a chosen geometry
For a further hypothetical geometric screen, stipulate that half the 30 g separated inventory adheres, giving 15 g. If that mass were spread uniformly over 0.50 m² with an assumed density of 1000 kg/m³, thickness would be h = m/(ρA) = 0.015/(1000 × 0.50) = 0.000030 m = 30 µm.
This is not a prediction of a valve’s coating thickness or clearance loss. Real deposits are nonuniform, have different composition and density, and may concentrate on selected surfaces. The calculation only shows why “just a few grams” is not an adequate dismissal. The relevant geometry and component response must be established before inferring sticking or functional risk.
Particle cleanliness and deposit-related condition can diverge
A particle counter addresses populations within its measurement basis; it does not weigh all dissolved degradation products or inspect attached films. Low counts therefore cannot exclude a soluble precursor inventory, very small material outside the reported size channels or existing surface deposits. Sampling and instrument interference also require their own controls.
SKF’s January 2026 oil-degradation paper shows why particle count, acid number, viscosity and deposit-related indicators should be interpreted together. An apparently stable acid number or viscosity does not make every other result irrelevant. Use changes against the correct new-oil reference and operating history, rather than treating one normal result as a general health certificate.
MPC is a colour-based trend, not a mass concentration
The current public scope of ASTM D7843-25e1 describes collecting insoluble material from in-service turbine oil on a membrane and reporting a CIELAB colour-difference value, ΔE. It presents the result as a condition-trending tool and excludes oils containing dyes. The laboratory method and its conditioning requirements must be followed for a valid comparison.
A ΔE value is not mg/L of varnish, micrometres of film, remaining valve clearance or a universal shutdown threshold. Do not insert an MPC number as concentration into the mass balance below. ExxonMobil’s analysis profile separately describes deposit-related tests, antioxidant evaluation, oxidation stability, acid number and water; their distinct purposes explain why a combined interpretation is needed.
Removal from the oil can be followed by replenishment from surfaces
A treatment may remove accessible suspended or soluble species by a mechanism suited to them. Mechanical particle interception, adsorption and a change in solvency are different mechanisms. Dissolving a deposit transfers material into the oil; without a removal path it does not reduce total inventory. Compatibility with the lubricant, additives, seals and operating duty must be established for the selected treatment.
An oil change can similarly leave attached material behind, and subsequent operation can redistribute it. A falling fluid result should therefore be followed with operational evidence and trends through the relevant temperature cycles. It does not automatically prove that inaccessible passages or surfaces have been cleaned. Avoid extrapolating a short demonstration to every deposit type or system.
Separate cleanup example: include ongoing generation
For an independent isothermal, well-mixed accessible pool, let V = 2000 L, treatment flow Q = 100 L/h and stipulated single-pass removal fraction η = 0.80 for the modelled species. Assume constant generation g = 0.40 g/h, no surface exchange, no precipitation and no loss of treatment capacity. Then V dC/dt = g − ηQC, with C in g/L. The rate constant is ηQ/V = 0.040 h⁻¹, time constant 25 h, and asymptotic concentration g/(ηQ) = 5 mg/L.
From C0 = 30 mg/L, C(t) = 5 + 25 exp(−0.040t) mg/L gives 14.572 mg/L after 24 h. Accessible inventory falls by 30.855 g, but 9.600 g has also been generated, so cumulative removal is 40.455 g. Reaching an illustrative 10 mg/L takes ln[(30 − 5)/(10 − 5)]/0.040 = 40.236 h. These are model outputs, not a treatment guarantee or an MPC target; real surface release and finite media capacity can invalidate the simple exponential.
Verify both the cause and the result of intervention
Combine oil identity and history with sampling conditions, deposit observations, valve response, local temperatures, aeration, water and relevant filtration behaviour. Investigate the mechanism producing or redistributing material; repeatedly cleaning without understanding that mechanism can leave the cause active. Confirm the selected response with the equipment and lubricant requirements.
The useful chain is generation → distribution between dissolved, suspended and attached material → a measurement with a defined scope → a compatible intervention → verified system response. The inventory examples explain phase and mass conservation; the laboratory tests describe selected properties. Keeping those roles separate makes a low particle count informative without allowing it to hide a deposit problem.
Sources
- Pall — Effective Varnish Removal from Turbine Lubrication Systems.
- ASTM D7843-25e1 — Measurement of lubricant-generated insoluble color bodies using membrane patch colorimetry.
- SKF — Oil degradation: limits of single-parameter analysis, PUB LS/S9 20306-2 EN (January 2026).
- ExxonMobil — Mobil Serv compressor extended service analysis profile.