Knowledge / Maintenance and reliability
Lubricating-oil analysis: sampling, contamination and trend interpretation
Build comparable circulating-oil samples and distinguish concentration, contamination, oil condition and evidence of mechanical wear.
On this page
A laboratory result describes the material in a bottle through a particular test method. Its value for a ship’s machinery depends on whether that bottle represents the intended oil circuit and whether the result is compared with a suitable history. This article concerns representative sampling and trends in circulating lubrication systems. Cylinder-feed distribution and local acid neutralization require a separate engine-specific evaluation.
State which oil population the sample represents
A system reservoir, a bearing return, a filter drain and a purifier discharge are not interchangeable sample populations. A circulating-system trend needs a consistent point representative of the intended active oil. A sample taken specifically to investigate trapped debris or separator performance may be useful, but it answers a different question and should not silently join the routine trend.
The CIMAC used-engine-oil guideline, section 2, emphasizes repeatable location, procedure, clean containers, equipment details and a fresh-oil reference. Its application table includes many marine machines, but the document itself limits its detailed scope to engine oil. Hydraulic systems, gears and stern-tube lubricants need their own suitable tests and equipment guidance.
Make sampling repeatable and safe
Use the approved sample connection and procedure under a defined operating condition. Flush the connection as specified to remove stagnant material, keep the container clean and close it promptly. Do not improvise an opening on a pressurized or hot line. The amount flushed depends on the connection volume and procedure; a universal number detached from the installation can leave contamination behind or create unnecessary exposure.
Record equipment identifier, exact sample point, sampling time, machine hours, oil hours, product, load, temperature context, top-ups, oil changes and unusual events. Label the bottle and record before the identity becomes uncertain. If the machine had been stopped for a long period, settling may change the sample. A one-off cold drain sample should carry that qualification rather than masquerade as the previous warm circulating sample.
Keep oil condition, contamination and wear separate
Viscosity at a stated test temperature characterizes resistance to flow; water content measures a contaminant; elemental analysis measures selected elements; particle examination supplies another view of solids. None is a universal health score. A viscosity rise may accompany oxidation, soot, contamination or an incorrect product. A decrease may accompany dilution or a different product. The operating history determines which explanations are plausible.
CIMAC Recommendation 30 describes routine and additional analytical methods and their limitations. An element can originate in an additive, a contaminant or a machine material. Compare a fresh-oil reference and material information before assigning a source. Several consistent signals are more persuasive than a solitary elevated element, but a dangerous isolated result still deserves timely assessment.
Understand what the analytical method can miss
Different tests respond to different particle sizes, materials and forms. Routine elemental spectroscopy and examination of larger wear debris do not measure the same population. A low reported iron concentration does not establish the absence of large ferrous fragments; a particle count does not identify every particle’s composition. Ask the laboratory what preparation, size response and detection limit apply to the reported result.
Keep test methods and units visible when changing laboratories. Results labelled “water” can come from screening or quantitative methods with different capabilities. A change in a reported number may reflect method rather than equipment. Preserve less-than signs and detection limits; replacing “below 5 mg/kg” with zero invents precision. For dark or contaminated oils, confirm whether the selected particle method remains suitable.
Calculate dilution before calling a lower result improvement
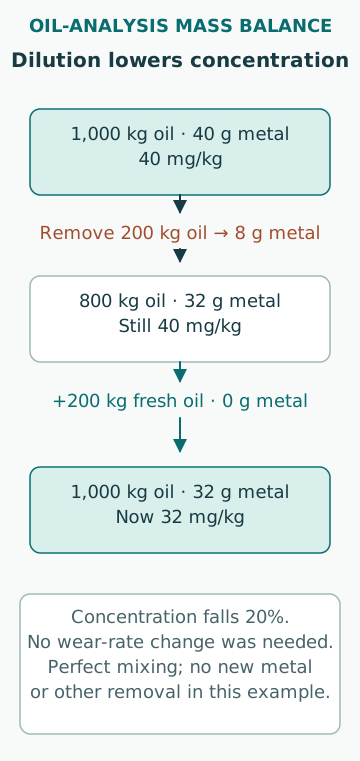
Consider an original perfectly mixed reservoir example. A 1,000 kg oil inventory contains 40 mg/kg of a measured metal, so the represented metal mass is 40,000 mg, or 40 g. Remove 200 kg of homogeneous oil and replace it with 200 kg of fresh oil containing none of that metal. The remaining measured mass is 32 g and the new concentration is 32 mg/kg, a 20% fall with no change in wear generation.
This is a mass balance, not a prediction for a real sump. Fresh oil may already contain the element, deposits may retain material, filtration may remove particles selectively and the reservoir may not mix completely. If 10 g of newly measured metal subsequently enters the same 1,000 kg inventory, concentration becomes 42 mg/kg in this simplified closed balance. Trend interpretation must therefore include oil movement and treatment, not just elapsed running hours.
Compare like operating periods
A result of 30 mg/kg after 100 h and 50 mg/kg after 1,000 h cannot be ranked purely by concentration. Nor is dividing by oil age always sufficient: concentration depends on generation, loss, top-up and removal. Use plots with dated events and distinguish machine age from oil age. A bearing replacement may reset one component’s condition while leaving old oil and debris in the system.
Build a baseline from stable operation using the same method and similar load. Identify step changes after product changes, repairs, contamination events and filter work. A stable abnormal level and a rapidly rising modest level pose different questions. Statistical control limits describe historical variation; equipment rejection limits describe acceptability. Neither should silently replace the other.
Keep units and sample handling visible
Milligrams per kilogram is a mass fraction; milligrams per litre is a mass per volume. They are not numerically interchangeable without oil density at the applicable condition. In a hypothetical oil of density 0.88 kg/L, 100 mg/kg corresponds to 88 mg/L. A laboratory change that switches units can look like a sudden improvement if the unit field is lost.
Handling may also change what reaches the instrument. Settling, inadequate mixing before subsampling, transport contamination or water separation can affect representativeness. Record unusual bottle appearance and ask the laboratory about its preparation method rather than attempting to reinterpret an unexplained result alone. A retained sample supports a targeted recheck only when storage and sample stability are suitable for the test in question.
Use treatment changes as explanatory events
A cleaner sample after replacing a filter may reflect removal of particles rather than elimination of their source. That can be an important improvement, but the two mechanisms imply different future behaviour. If the generating fault persists, the filter can load again. Pair the oil trend with filter differential pressure, debris observations and verified treatment condition when relevant.
Likewise, apparent wear-metal reduction following an oil change should be plotted as a reset, not connected by a simple downward health trend. Keep pre-change evidence available for diagnosis and establish the new baseline with the correct product. The interpretation should answer three distinct questions: what is currently in the oil, why it changed and what that change implies about the machinery. The final question usually needs evidence beyond the bottle.
Investigate a discordant result without erasing it
When a result is inconsistent, check identity, collection conditions, units and method first. A repeat sample can help distinguish a sampling problem from a persistent condition, but record both results and the reason for repeating. Do not repeatedly sample until a favourable number appears. If the equipment evidence indicates immediate danger, waiting for another bottle must not delay the approved protective response.
Choose follow-up tests to discriminate between explanations. Suspected water ingress may require checking the cooling boundary and a suitable water test; suspected large wear debris may require filter inspection or a complementary particle method. The useful outcome is a causal question with a planned check, an accountable reviewer and a deadline linked to consequence. Routine colour coding alone cannot provide that chain of reasoning.
Sources
- CIMAC Guideline Used engine oil analysis · CIMAC · Source check date: 2026-10-06
- Recommendation 30: Used Oil Analysis — User Interpretation Guide · CIMAC · Source check date: 2026-10-06