Knowledge / Navigation and marine safety
Ice navigation: ice charts, concentration and ship operating limits
Read ice concentration as an area statistic, retain ice type and chart age, and connect the resulting evidence to the particular ship’s documented operating limits.
On this page
An ice chart describes an evolving environment. It is neither a strength certificate for the vessel nor a promise that every part of a colored polygon has the same conditions. An original mixture comparison and a separate drift calculation show why chart interpretation must retain ice type, observation time and ship-specific limits together.
Ask what information product is being read
An analysis, a forecast and a climatological summary answer different questions. The first estimates conditions for a stated time; the second projects later conditions; the third summarizes a longer record. Canadian Ice Service product descriptions distinguish chart sources, coverage and detail. A familiar map format does not make those products interchangeable.
Before interpreting a polygon, record its valid time, publication or receipt time, legend and geographic coverage. Data gaps are not open-water observations. A high-resolution display also cannot add detail that was absent from the underlying information. The relevant question is what the product actually supports at the location and time of the proposed assessment.
Read concentration as a fraction of area
The Canadian Ice Service egg-code guide expresses total and partial ice concentrations in tenths, with separate development-stage and floe-size information. Concentration describes areal coverage. It is not a thickness, a hull-load measure or the probability that a particular ship will strike ice. These quantities require additional physical and spatial information.
For clarity, this article uses written mixtures rather than reproducing an official coded egg. That avoids making a simplified classroom mixture look like a complete chart report. The exercise retains the essential distinction between total coverage and the coverage associated with each ice type; it deliberately leaves floe arrangement and local passage opportunities unspecified.
Work through an original mixture
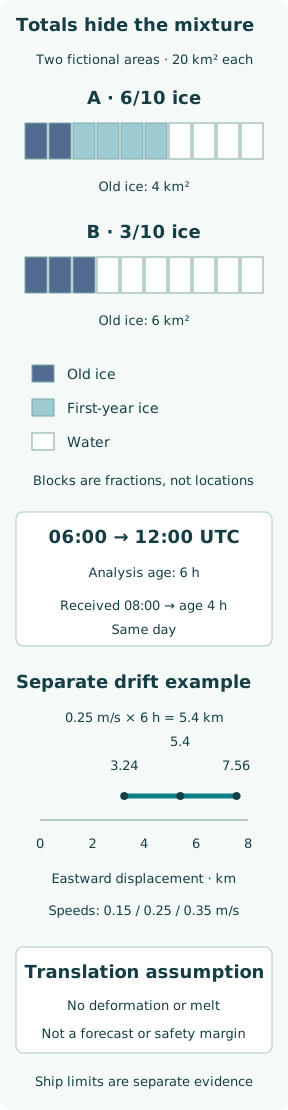
Take fictional area A with total area 20 km². Old ice occupies 2/10, first-year ice 4/10 and water the remaining 4/10. Total ice concentration is 6/10. The corresponding areas are 4 km² of old ice, 8 km² of first-year ice and 8 km² of water; their sum recovers the stated polygon area.
The 12 km² of total ice could be arranged in many ways inside that polygon. Separate scattered floes, a compact band across a route and uneven subareas can share the same aggregate fractions. Without spatial arrangement, no proportion of the route length or maneuvering room follows directly. Area arithmetic verifies the mixture; it cannot reconstruct the ice field.
Show why lower total concentration need not settle the comparison
Now give equal-sized fictional area B 3/10 old ice and 7/10 water, with no first-year ice in the exercise. Its total ice area is 6 km², all old ice; water occupies 14 km². B has lower total concentration than A while containing a larger old-ice area: 6 km² instead of 4 km².
That comparison does not rank the two areas as safe or unsafe. It proves only that total concentration loses information important to a ship-specific assessment. A rule that selects whichever polygon has the smaller total would discard the mixture difference. Neither the larger water fraction nor a more attractive color supplies the missing evidence about the actual route through the polygon.
Attach the observation age to the chart
Suppose a fictional analysis is valid at 06:00 UTC, received at 08:00 and considered for a 12:00 assessment on the same day. The analysis age is 6 h, while time since receipt is 4 h. Confusing those clocks makes the environmental description appear younger than its stated validity. A newly downloaded file can still describe earlier conditions.
The valid time does not necessarily mean every observation used in the analysis occurred at that instant. Source acquisition times and analysis methods can add another layer of age and uncertainty. In a review record, distinguish what is explicitly supplied from what remains unknown. “Latest available” is a statement about product availability, not a guarantee of present local conditions.
Calculate drift as a sensitivity, not a forecast
Use a separate idealized boundary that translates east at constant 0.25 m/s for the 6 h since the analysis time. Displacement is vΔt = 0.25 × 6 × 3600 = 5400 m, or 5.4 km. The exercise excludes rotation, deformation, growth and melt; it does not forecast the boundary of either mixture area above.
If chosen alternative speeds are 0.15 and 0.35 m/s, displacements become 3.24 and 7.56 km. This bracket illustrates sensitivity to a rate assumption, not a probability interval or an operational buffer. A route near an old boundary needs information about the actual evolving field. Adding the largest toy displacement to every chart would create an unsupported universal rule.
Retain the local conditions hidden by a polygon
The Canadian Coast Guard warns that ice charts describe area averages and that local conditions can differ materially. Its discussion also distinguishes product limitations concerning ridging and pressure from the broader information available through other observations. Therefore, absence of a particular feature from one chart type cannot automatically establish that the feature is absent in the water.
In the mixture example, neither A nor B states floe size, thickness distribution, pressure, ridge geometry or visibility. Those omissions are deliberate and consequential. Listing them identifies what prevents a route decision from following from the arithmetic. The exercise remains useful precisely because it shows where the evidence ends rather than filling the gaps with assumed benign conditions.
Bring in the particular ship’s documented limits
IMO’s Polar Code summary links certification and operational assessment to the Polar Water Operational Manual and the ship’s capabilities and limitations. For a ship and voyage to which those requirements apply, the relevant evidence is the actual documentation and applicable rules. A broad category label alone is not a numerical permission to enter every charted mixture.
Imagine two otherwise unspecified vessels reviewing the same areas. Their documented limits, machinery vulnerability, arrangements and procedures may differ, so one shared chart cannot yield one universal answer. This example assigns neither vessel an invented ice-class allowance. If the documentation or required assessment method is unavailable, a capability conclusion remains unsupported even when the chart fractions are fully understood.
Connect changing conditions to a decision window
A chart-based assessment has dependencies: expected passage time, available updates, current observation quality and the ship’s relevant limitations. If the ice regime changes, the basis of that assessment changes too. A useful decision record identifies which change would require reassessment and whether a suitable alternative remains available at that point in the voyage.
This is different from selecting a generic speed from concentration alone. The original calculations contain no resistance, structural loading, stopping performance or propulsion model, so they cannot produce an operating speed. Even a more elaborate numerical ice index must be applied using the correct ship-specific method and assumptions; displaying a single score does not remove those dependencies.
Keep the final record physically honest
For area A, the exercise establishes 12 km² total ice with 4 km² old ice; for B, 6 km² total ice with 6 km² old ice. Separately, it establishes that an assumed constant drift over 6 h can move a boundary 5.4 km. The mixture and drift results describe different aspects of information quality and must not be fused into an invented current chart.
A defensible real assessment would combine appropriate current ice products, local evidence, applicable ship documentation and qualified operational judgment. It would preserve limits when the information is incomplete. The transferable lesson is that concentration, composition, age and capability answer different questions, and a useful ice-chart interpretation keeps all of them visible before drawing a navigational conclusion.