Knowledge / Risk analysis methods
Bow-tie and inherently safer design: where source reduction belongs in the model
Compare concepts delivering the same production duty, redraw the hazard and loss-of-control boundaries, and check where reduced inventory or substitution transfers hazards.
On this page
A smaller hazardous inventory changes what can be released. Removing a particular material can remove that source altogether. Neither change is simply another success probability on an unchanged bow-tie. This original cleaning-process comparison holds the production duty constant while separating source reduction, remaining protection and hazards introduced elsewhere.
Start from the required service, not the existing equipment
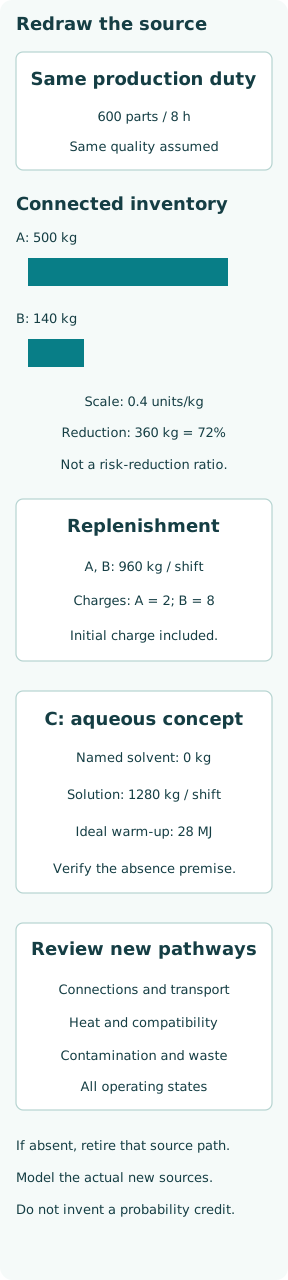
Define the fictional duty as 600 components cleaned to the same specified condition during an 8 h shift, with the same acceptable material compatibility and finished-part quality. This is 75 parts/h. Assume three concepts can meet that duty for the calculation; the assumption would need demonstration before a real design comparison could rely on it.
The comparison boundary includes receiving, storage, the cleaning process, temporary connections, return paths and waste handling. A concept that merely moves a bulk store outside the process-room boundary has not necessarily reduced the site’s hazardous inventory. State both the local scenario boundary and the wider lifecycle boundary so a smaller diagram does not become a misleading claim of a safer whole operation.
Locate source reduction before barrier credit
HSE’s plant-design guidance considers minimizing inventory and substituting materials at the design stage. In bow-tie terms, these changes can alter the hazard itself, the threats that can release it and the material available after loss of control. A smaller vessel is not automatically a second independent protective function attached to the original larger vessel.
Distinguish source reduction from a device that detects an abnormal condition and acts successfully or unsuccessfully on demand. The remaining concept may still need engineered protection and supporting assurance. Reducing the source does not demonstrate that those functions can be removed. Their requirements must be derived again from the changed process, credible challenges and applicable engineering constraints.
Compare three explicit concepts
Concept A uses a nominal 480 kg carrier charge with 20 kg fixed process holdup. Concept B uses a 120 kg charge with the same 20 kg holdup. Both have a stipulated carrier-supply duty of 120 kg/h. Concept C uses a different aqueous process, assumed compatible with the same part-cleanliness duty, with 200 kg working solution and supply duty 160 kg/h.
| Concept | Source definition | Transferred-hazard question |
|---|---|---|
| A: large supply | 480 kg + 20 kg | 2 charges/shift; flammable carrier remains. |
| B: small supply | 120 kg + 20 kg | 8 charges/shift; review deliveries and connections. |
| C: aqueous option | 200 kg solution; named solvent absent | Review heat, compatibility, waste and extra handling. |
No real chemical is specified and no substitution is recommended. For the named flammable-solvent source, C is defined to contain none in fresh media, incoming part residues or waste within the chosen boundary. That absence is a premise to verify, not a property of every water-based cleaner. Unknown additives, contamination or mixed waste would reopen the source claim.
Calculate the inventory change without calling it risk reduction
At the defined snapshot after external supply is disconnected, A has 480 + 20 = 500 kg of connected carrier inventory. B has 120 + 20 = 140 kg. The reduction is 360 kg, or 0.72 of A’s inventory; B retains 0.28 of A’s value. The same units and included volumes are used for both concepts.
This is a connected-inventory comparison, not a spill prediction. It presumes the stated isolated charge, excludes continuing feed and requires a check for drainable returns and other connected sources. Release fraction, temperature, evaporation, ignition, geometry and exposure can change the consequence. A 0.72 inventory reduction therefore does not establish a 0.72 reduction in accident frequency, harm or any combined risk metric.
Keep replenishment and production assumptions visible
Each solvent concept supplies 120 × 8 = 960 kg per shift. Dividing by the charge size gives nominal counts of 2 charges for A and 8 for B, including the initial charge attributed to that shift. B’s nominal count is four times A’s. Those counts are scheduling requirements under the example assumptions; they are not measured delivery frequencies or probabilities of release.
A smaller buffer may increase connection activity, transport demand or reliance on timely supply. Verify how the required duty is met without adding uncounted standby inventory or unsafe work pressure. If changeover downtime means B cannot deliver the same output, the like-for-like assumption has failed. The calculation intentionally does not claim that the nominal charge arithmetic proves throughput feasibility.
Redraw the hazard and top-event definitions
CAA’s bow-tie guidance uses the hazard to establish the model’s context and scope. For A and B, a useful local top event remains loss of containment of the named carrier from the connected process. The inventory and possible release states differ, so the right-hand consequence model and the demand on mitigation must be reassessed.
For C, the named flammable-solvent loss-of-containment pathway is absent only while its source-absence premise holds. Do not leave the old hazard intact and multiply its probability by an invented “elimination barrier” factor. Build a new model for the actual solution, thermal energy, mechanical activity and waste pathways. A removed source and a highly reliable protective action make different logical claims.
Trace hazards introduced by the alternative
NIOSH’s substitution guidance calls for comparison of new risks introduced by a substitute. C supplies 160 × 8 = 1280 kg of solution per shift, which is 320 kg more supply mass than the solvent concepts in this example. Different handling and waste routes may follow. Mass alone cannot rank toxicity, flammability, ergonomics or environmental burden.
For a separate thermal illustration, heating C’s 200 kg working solution through 35 K with constant heat capacity 4 kJ/(kg·K) requires 28000 kJ, or 28 MJ. This is ideal sensible warm-up energy only. Vessel heating, losses and ongoing process demand are excluded. It highlights a thermal-energy source that deserves a hazard review; it neither sizes a heater nor predicts injury from contact.
Use a pathway register rather than one attractive score
For each concept, keep the receiving source, process containment, energy inputs, connection tasks, drainage, waste and foreseeable abnormal states in one comparison register. Ask which threats disappear, which change magnitude and which are newly introduced. A common-service failure or mistaken connection can remain relevant even when the inventory is smaller or the media have different properties.
Do not combine kilograms of flammable material, warm-up energy and handling counts by adding their raw numbers or multiplying ordinal bow-tie colours. They describe different physical quantities. If a decision needs a quantitative risk comparison, develop compatible scenarios and consequence endpoints with justified frequencies and dependencies. Until then, retain a multidimensional comparison with explicit unresolved evidence.
Specify what evidence would establish equivalence
The assumed common production duty needs evidence for cleaning quality, material compatibility, output rate, availability and waste treatment. Source-absence claims need composition and contamination boundaries. Connected-inventory claims need the actual configuration, including supply and return paths during the relevant state. An equipment-only datasheet is not proof of the complete operating concept.
Check normal operation, replenishment, start-up, shutdown, cleaning and maintenance separately. An inherently reduced normal inventory can coexist with a larger temporary inventory during a different activity. Likewise, a safer ingredient can produce a hazardous mixture or residue in use. The comparison should follow the actual states in which people, equipment and the environment can encounter the sources.
State the conclusion at the strength the model supports
Under the original assumptions, B reduces the connected-inventory snapshot from 500 kg to 140 kg while increasing nominal charging count from 2 to 8 per shift. C removes the narrowly specified solvent source by definition and introduces a different material and thermal profile. All retain the same stated production duty as a hypothesis requiring verification, not an achieved plant result.
The bow-tie’s role is to reveal how the source, loss of control, barriers and consequences change together. It does not select a concept from inventory alone. A defensible choice preserves the common duty, includes transferred hazards and keeps engineering protection tied to the remaining scenarios. The strongest benefit claim names the physical source actually reduced and the evidence supporting that boundary.