Knowledge / Risk analysis methods
Barrier indicators: leading evidence, lagging events and misleading counts
Choose indicators that reveal a specific barrier weakness, keep denominators and reporting boundaries visible, and connect a changing measure to an actual decision.
On this page
A dashboard can show fewer incidents while a protective function becomes less dependable. It can also show more recorded defects because inspections have improved. Barrier indicators are useful only when the reader understands what is being counted, the opportunity for it to occur and the connection to the barrier’s required function. The purpose is to recognize meaningful change early enough to investigate and act, while retaining evidence about failures that have already occurred.
Begin with the failure mechanism you want to detect
HSE HSG254 pairs leading and lagging evidence for important risk-control systems. For a shipboard barrier, begin with the specific loss of function, such as delayed isolation, insufficient delivered cooling or unavailable indication. Then ask which observations would reveal deterioration before the major consequence and which observations show the function has already failed.
If a barrier depends on an unobstructed sample path, an indicator concerning actual sample-flow deficiencies can be more informative than the number of generic safety meetings held. If a barrier depends on a timely human response, relevant cue availability and demonstrated task performance matter. A metric should earn its place by its connection to the mechanism, rather than because the data are easy to collect.
Distinguish activity from delivered capability
IOGP Report 556 distinguishes evidence of barrier weakness from inputs intended to maintain effectiveness. In an original example, tests completed on schedule is an activity measure; the proportion of tested functions that fail their defined response criterion is outcome evidence about those tests. Both can be useful, but they answer different questions.
Completing every scheduled task cannot demonstrate capability if the task does not challenge the relevant failure mode. Conversely, finding defects during a strengthened inspection programme need not mean the programme has made the equipment worse. Compare the activity and its findings, and retain the type and quality of work. Administrative completion without a result should not be presented as a passed functional test.
Read counts with the exposure denominator
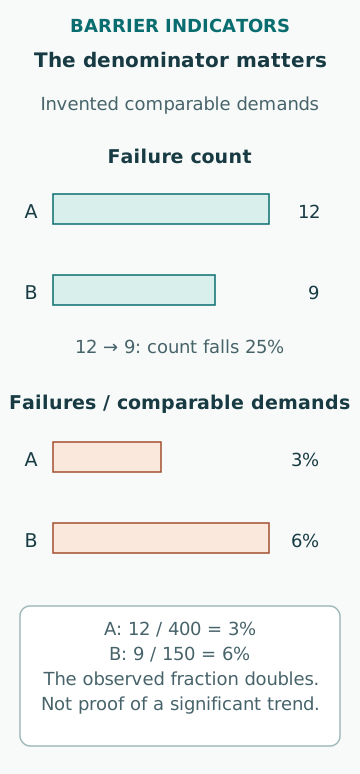
Suppose one period records 12 failures in 400 comparable demands, while another records nine failures in 150 comparable demands. The failure count has fallen by 25%, but the observed failure fraction rises from 12/400 = 0.030 to 9/150 = 0.060. The descriptive fraction has doubled. This arithmetic alone does not establish a statistically significant trend or identify its cause.
The denominator must represent the relevant opportunities. Operating hours, starts, demanded actuations, transfers and inspections are not interchangeable. A standby barrier may have many calendar hours but few real demands. If the population includes unlike demand conditions, the overall ratio can change because the mix changed. Preserve the condition categories needed to distinguish that effect from a genuine change within one category.
Keep backlog measures interpretable
For a separate example, five overdue tasks among 50 due tasks represent 10%; ten overdue among 200 due represent 5%. The overdue count doubled while the fraction halved. Neither view tells the whole story. The age of the overdue work, affected barrier, failure mechanism and number of impaired functions can matter more than the count.
A task is an administrative unit that can be split or merged. Dividing one large job into many small jobs can improve a completion percentage without restoring any additional protective capability. Keep task definitions stable, and supplement workload measures with the actual unresolved impairments they relate to. An overdue-task fraction is not a barrier failure probability and should not be inserted into a LOPA or event tree as one.
Separate time unavailable from failure on demand
Assume a barrier is confirmed unavailable for 40 h within a defined 2,000 h period in which the protected activity is exposed. The observed time-unavailable fraction is 40/2,000 = 0.020. It describes that observation period and that activity. Counting calendar hours when the protected activity was absent would change the denominator and the question.
The 0.020 fraction is not automatically the probability of failure when demanded. That interpretation needs a relationship between demand timing and the unavailable state. If the disturbance that creates a demand also removes power from the barrier, demand and impairment are linked. The time history can still be valuable, but the quantitative risk model must represent the dependency rather than equate all availability measures.
Show evidence quality alongside the number
A reported zero can mean no failures, no relevant demands, missing records or an unobserved failure mode. Those states need different labels. Record data completeness, applicable asset population, definitions and known gaps. A denominator of zero makes a failure fraction undefined; replacing it with zero gives a false appearance of perfect performance.
Improved reporting can increase the recorded count even if the underlying condition is unchanged. A revised detection threshold, new sensor or changed failure coding can also break comparability. Annotate such changes and, where feasible, reconstruct a consistent series. Avoid interpreting every step change in a dashboard as a physical deterioration or improvement before checking the measurement process.
Choose action levels with a reason
An indicator needs an intended response: investigation, confirmation of data, examination of a particular barrier, or escalation through the applicable impairment process. The action level should relate to the performance requirement, evidence uncertainty and consequence of missing the problem. A red threshold copied from another fleet may have no meaningful relation to the current barrier or exposure.
Some findings warrant attention even when an aggregate rate remains low, such as a newly discovered shared dependency that defeats several credited functions. Other apparent changes may need more data before their statistical meaning is clear. The indicator should support that judgement, not force every technically different situation into the same traffic-light rule. Do not average away a serious single impairment merely because many unrelated checks passed.
Use local detail and comparable summaries
The IOGP Report 456 public description frames leading and lagging indicators as evidence about barrier health. Local indicators often need detailed failure definitions, while wider summaries need consistent boundaries. A summary should preserve the ability to identify which barrier and scenario account for a change.
A fleet-wide average can be dominated by the vessel with most recorded demands. If another vessel has a small number of unusually severe or difficult demands, the overall average may conceal its condition. Compare like populations and show the relevant distribution when it changes the decision. Weighting several indicators into one score requires an explicit interpretation; an arbitrary numerical score does not become a physical measure of risk.
Close the measurement-to-action loop
For each indicator, record the barrier and failure mechanism, numerator, denominator, population, collection method, data owner, review interval and intended response. Track what an investigation found and whether the resulting action changed the relevant capability. If an indicator repeatedly triggers without producing useful decisions, reconsider its definition or the response process.
The strongest indicator set combines a small number of meaningful measures with access to the underlying evidence. It makes a detected weakness visible before severe harm where possible, while also learning from demands and failures. A favourable trend is useful only within its stated measurement limits; a dashboard remains an aid to understanding barriers, not a substitute for showing that they work.
Sources
- HSG254: Developing process safety indicators, 2006 · UK HSE · Source check date: 2026-10-07
- Process Safety – Leading key performance indicators, Report556 · IOGP · Source check date: 2026-10-07
- Process safety – recommended practice on key performance indicators, Report456 · IOGP · Source check date: 2026-10-07