Knowledge / Risk analysis methods
FMECA criticality: severity, occurrence and the meaning of a ranking
Interpret qualitative criticality and exposure-based calculations while keeping severity, failure-mode fractions, consequence probabilities and mission assumptions distinct.
On this page
Adding a criticality column to an FMEA creates a prioritization method only when the quantity in that column has a defined meaning. A severity category, an estimated failure frequency and a score assembled from rankings are different kinds of information. They cannot be compared or added as if they were all measured risk. FMECA becomes useful when it preserves those distinctions and explains which engineering decision the ranking is intended to support.
Define the decision and consequence category
IEC60812’s public description distinguishes FMEA’s identification of failure modes and effects from a criticality ranking that includes at least consequence severity. It also states that the generic standard is not detailed safety-application guidance. Decide whether the analysis supports design treatment, maintenance investigation, spare-parts planning or another purpose before constructing its ranking.
A mode important to service availability may differ from one important to personnel safety or environmental protection. Define consequence categories in terms the system assessment can recognize, including the operating mode and duration. A label such as severe without an explained endpoint can conceal different outcomes in different worksheets. The category must remain visible even if a later index helps sort the rows.
Separate mode fraction from effect probability
The definitions in NASA’s public2019 rotorcraft FMECA report distinguish a failure-mode ratio from the conditional probability of a specified end effect given that mode. The report’s aircraft-specific rates and judgments are not transferred here. The conceptual distinction is useful for marine examples because a component failure and loss of the required ship function are not always the same event.
Use α for the fraction of the item’s failures assigned to a defined mode and β for the conditional probability of the specified consequence given that mode under the considered conditions. These symbols are defined locally; β is not a Weibull shape parameter in this calculation. Both fractions need a clear denominator. Do not multiply by α again if the input rate already represents that failure mode rather than the whole item.
Work the conventional criticality expression with units
NASA-HDBK-8739.19-2 presents the conventional mode expression Cm = βαλpt in its criticality discussion. Write the rate units explicitly. For invented values λp = 2.00 × 10⁻⁵ h⁻¹, α = 0.300, β = 0.500 and exposure t = 2,000 h, the product is Cm = 0.00600. This is a dimensionless exposure-weighted quantity for the specified effect, not a severity score.
The same item rate is 20 failures per million hours; using the number 20 with time in hours without the 10⁻⁶ conversion would be wrong by a factor of one million. The inputs are illustrative rather than observed fleet statistics. Record the population, environment, failure definition and exposure basis behind a real rate before using it in this expression.
Do not silently call the product an exact probability
The NIST exponential model gives the first-failure probability 1 −exp(−λt) under a constant-hazard lifetime model. Suppose a non-repairable item has the total rate and time from the example, and constant mutually exclusive mode proportions. The probability that its first failure has the chosen mode and produces the effect is αβ[1 −exp(−λpt)] = 0.15[1 −exp(−0.04)], approximately 0.005882. The simple product 0.00600 is a small-exposure approximation for this model.
A different recurrent-event model, with a Poisson consequence count whose mean is 0.00600, would give probability 1 −exp(−0.00600), approximately 0.005982, of at least one consequence. Neither exact expression follows from the index alone. State whether the model concerns first failure, repeatable events, repair, competing modes or another mechanism. A dimensionless number is not automatically a probability just because it lies below one.
Aggregate only compatible contributions
In a separate bookkeeping extension, let another non-overlapping mode of the same item have α = 0.200 and β = 0.100 for the same consequence category, with the same item rate and exposure. Its conventional contribution is 0.000800, giving a combined index 0.006800 with the first mode. This sum retains one category and one exposure basis. It is not a general total-risk measure across unlike harms.
If two worksheet rows describe overlapping manifestations of the same physical failure, adding them can double-count. Similarly, adding a component-level effect to the same effect already included at system level duplicates the pathway. Trace the event identity and hierarchy before aggregation. A large table is not evidence that its rows form a mutually exclusive or complete partition.
Keep qualitative ranks in their own role
Where usable rate data are absent, a structured qualitative matrix can communicate severity and an explicitly defined occurrence class. The class boundaries and decision rules belong with the matrix. An ordinal category records order within that scheme; it does not establish how many times more likely one category is than another. Do not invent a precise probability by treating the category number as a measured frequency.
Two modes with similar numerical indices may still require different treatment because their consequences differ. Conversely, a low occurrence estimate with poor evidence should not automatically erase a high-severity concern. Preserve the severity description, confidence in evidence and reason for the selected treatment. The ranking supports judgment; it does not replace requirements or the underlying hazard argument.
Show how uncertainty changes the ranking
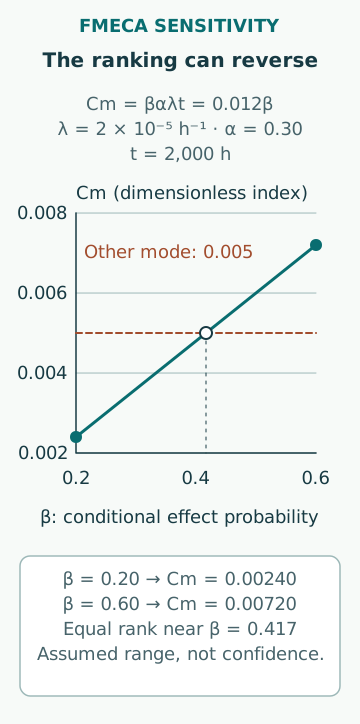
Return to the first conventional example and vary only β from 0.200 to 0.600 while retaining λp, α and t. Cm ranges from 0.00240 to 0.00720, a factor of three. If a competing mode has index 0.00500, its position relative to the first mode depends on the unresolved conditional-effect assumption. Reporting the first mode as exactly 0.00600 without that sensitivity would hide a potentially unstable ranking.
This interval is an assumed sensitivity range, not a confidence interval. The inputs may also be dependent: a harsh operating condition can affect both the item failure rate and the chance that a backup fails to compensate. Treating those effects independently or varying one while holding another artificially fixed can misrepresent the uncertainty. Identify the mechanism behind the parameter rather than only the numerical range.
Connect treatments to the quantity they change
A design change may reduce the rate of a mode, reduce the chance that it causes the end effect, change the consequence itself or improve the evidence available for detection. These are different interventions. State which part of the chain changes and what supports the new value. A claimed diagnostic improvement does not automatically reduce the physical rate at which the failure occurs.
Also check whether a treatment introduces a shared dependency or another mode. Adding a backup does not justify a lower β unless its availability, capacity and response under the initiating condition are supported. If the original index already includes compensation, multiplying by another backup factor can credit it twice. The worksheet should expose these assumptions so a reviewer can reconstruct the reasoning.
Maintain the analysis as the system changes
The public scope of GSFC-HDBK-8004 describes FMECA as a living assessment updated with changes and new knowledge. For maritime use, retain the same principle while applying the actual vessel’s requirements and evidence. A revised operating profile, component, support service or failure-data definition can change the meaning of a previously ranked row.
Common mistakes are mixing hours with millions of hours, using a mode-specific rate and mode fraction twice, equating an index with an exact probability, aggregating incompatible consequences and hiding uncertainty behind decimal places. A useful FMECA record states the endpoint, time basis, rate provenance, mode fraction, conditional effect and model interpretation. It then connects the resulting priority to a justified engineering action rather than an unexplained score.
Sources
- IEC60812:2018 public catalogue description · IEC · Source check date: 2026-10-06
- NASA/CR-2019-220217 · NASA · Source check date: 2026-10-06
- NASA-HDBK-8739.19-2:Measuring and Test Equipment Specifications,2010 baseline,revalidated2018 · NASA · Source check date: 2026-10-06
- Engineering Statistics Handbook:Exponential model · NIST · Source check date: 2026-10-06
- GSFC-HDBK-8004 public scope,2024 · NASA · Source check date: 2026-10-06