Knowledge / Risk analysis methods
Pressure relief in LOPA: protecting the pressure vessel and assessing the discharge outcome
One pressure demand, two endpoints: calculate rupture prevention separately from harmful discharge and test what the claimed layer actually does.
On this page
A relief device can perform its pressure-protection function while material leaving it still creates a hazardous exposure. The analysis changes when the endpoint changes. This original worked example keeps rupture and harmful release separate, then reconnects them through an explicit event partition rather than awarding the same protection credit to both.
Name the endpoint before assigning credit
Write the consequence as a testable condition. “Vessel ruptures during this pressure demand” concerns containment failure. “A person encounters the defined hazardous concentration following this demand” concerns a release, its movement and exposure. A successful discharge may prevent the first without excluding the second. Neither a valve tag nor a generic protection-layer label identifies which condition has been prevented.
HSE describes pressure-system regulation in terms of the hazard from stored energy. The example therefore records rupture separately from exposure. It does not treat the absence of rupture as evidence that every chemical, thermal or environmental consequence is absent. Define the exposure location, duration and severity criterion before interpreting the harmful-release probability.
Bound one complete pressure-demand scenario
Consider an invented process receiver exposed to a demand frequency fI = 0.08 year⁻¹. A pressure-protection system either fails its specified task or successfully routes material away from the receiver. For this teaching model, failure always leads to rupture; success always avoids rupture but creates a discharge. Other outcomes, such as arrested escalation without either event, are outside this deliberately narrow partition.
Let q = 0.025 be the conditional probability of pressure-protection failure given the defined demand. It describes the entire required path, not merely a valve that fails to move. The demand definition, fluid state and available supporting systems are held fixed. These assumptions make the arithmetic reproducible without claiming that actual pressure excursions have only these outcomes.
Separate mechanical success from discharge success
Trace the boundary from the protected volume through the inlet, device, outlet piping and receiving destination. Ask which components must function to prevent rupture and which must function to prevent harmful exposure. A collection vessel can be part of the discharge-consequence argument even when it is not an additional independent layer against pressure rise. The allocation depends on the stated function.
HSE identifies safe discharge location, inlet pressure loss and backpressure as relief-system considerations. These are evidence requests here, not sizing instructions. A label that says “installed” does not establish capacity or suitability under the demand. The relevant evidence must concern the actual inlet/outlet configuration, fluid conditions, receiving-system state and pressure environment.
Assign conditional consequences to each branch
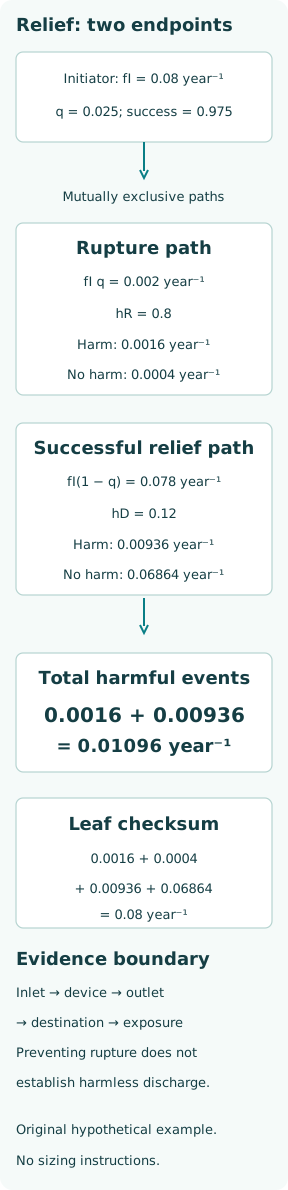
For the invented rupture branch, assign hR = 0.8 as the probability of the defined harmful exposure given rupture. For successful pressure relief, assign hD = 0.12 given its discharge. The difference could reflect different release locations and dispersion conditions, but the example stipulates these values rather than calculating atmospheric transport. They are neither valve failure probabilities nor occupancy factors to reuse elsewhere.
The four mutually exclusive leaves are rupture with harm, rupture without the selected harm, successful relief with harm, and successful relief without that harm. “Without harm” refers only to the chosen exposure criterion; it does not promise no damage or cost. Making this boundary explicit prevents benign wording from expanding a limited calculation into a general safety conclusion.
Calculate rupture and harmful-release frequencies
The rupture frequency is fR = fI q = 0.08 × 0.025 = 0.002 year⁻¹. The harmful rupture contribution is fI q hR = 0.0016 year⁻¹. Successful relief contributes fI(1 − q)hD = 0.00936 year⁻¹ to the exposure endpoint. These contributions can be added because their paths are disjoint for a single demand.
By the law of total probability, fH = fI[qhR + (1 − q)hD] = 0.01096 year⁻¹. The remaining leaf frequencies are 0.0004 year⁻¹ for rupture without selected harm and 0.06864 year⁻¹ for relief without selected harm. All four sum to 0.08 year⁻¹. Frequencies are expected event counts per year, not the probability of at least one annual event.
Check which branch now dominates the endpoint
Successful-relief exposure supplies 0.00936/0.01096, about 85.4% of the harmful-event frequency. This does not mean the relief system is ineffective: the rupture result and the exposure result answer different questions. It means that evaluating only failure to relieve omits the dominant exposure path in this particular constructed scenario. The distinction remains even if every input is known exactly.
A shortcut that applies q to all harmful outcomes silently assumes that successful relief eliminates the selected consequence. That is an assumption requiring evidence, not a property of the word “relief.” Conversely, counting every successful relief as harmful would impose hD equal to unity. Retain the conditional consequence model until the destination and exposure evidence justify either simplification.
Compare two changes without prescribing equipment
Change only hD from 0.12 to 0.03, retaining every other assumption. The alternative harmful-event frequency becomes 0.00394 year⁻¹, while rupture frequency remains 0.002 year⁻¹. This sensitivity isolates a hypothetical improvement in discharge consequences. It does not identify a suitable treatment technology, require a particular destination, or assert that the change is physically achievable at a real installation.
Instead change only q from 0.025 to 0.005. Harmful-event frequency becomes 0.009872 year⁻¹. Pressure protection is more reliable, but the harmful-release reduction is modest because the successful-discharge branch remains. Comparing these alternatives requires more than their frequencies: changes to capacity, dependencies, secondary hazards, maintainability and uncertainty could invalidate the assumed one-variable comparison.
Test independence against the initiating cause
The HSE/OMAR inspection guide describes LOPA around independent layers and a specified hazardous event. For this example, independence would need to cover the complete credited function. A shared utility or a common initiating blockage can defeat multiple supposed protections together. Multiplying independent failure probabilities is unjustified when the event itself removes the receiving path or its necessary services.
Use conditional states when a common destination serves multiple sources. A header already carrying another discharge can change the state of the pressure-protection path and the consequences of success. That coupling cannot be represented by assigning a free-standing discharge modifier after an unrelated valve calculation. Preserve the common state in both branches, or use a more explicit joint model.
Collect evidence at the claimed boundary
A review record should identify the protected equipment, initiating mechanisms, pressure-response assessment, required flow path and destination. Link the configuration to applicable design and inspection evidence rather than importing numerical credits from another service. State which demand conditions are covered and which are unresolved. Where reliable evidence is absent, retain the uncertainty instead of filling the gap with a familiar round number.
Test and maintenance records must match the function being claimed. Evidence that a device moves does not, by itself, establish unobstructed flow through the full system or acceptable exposure at the outlet. Equally, a destination assessment cannot substitute for demonstrating pressure protection. The review should be able to trace each probability to the event and physical boundary it actually describes.
Keep the result conditional and auditable
Report the initiator, partition, conditional probabilities, units and separate endpoint totals together. Record which inputs were stipulated, calculated or measured, and keep the mutually exclusive leaf sum as a basic consistency check. If a later study changes the pressure demand, receiving system or exposure criterion, revise the relevant branch logic before comparing old and new totals.
This example supplies no relief area, set pressure, discharge-system design or operating procedure. Those require a competent engineering assessment of the actual installation and applicable requirements. Its transferable result is narrower and useful: successful pressure relief is evidence for a particular function, while the destination and resulting exposure determine whether that success also prevents the consequence named in the risk assessment.