Knowledge / Machinery and energy
Liquid control-valve cavitation and flashing: the role of pressure recovery
Follow pressure through the vena contracta, separate collapsing vapour from persistent flashing, and work through a recovery-factor example without confusing choking with cavitation onset.
On this page
The pressure measured downstream of a control valve is not necessarily the lowest pressure experienced by the liquid. Flow accelerates through a local constriction, static pressure falls, and some pressure recovers as the jet expands. Whether vapour forms, collapses or remains downstream depends on that entire path and the fluid state. Two valves with the same end-to-end pressure drop can therefore expose the liquid to different local conditions.
Follow the pressure minimum, not only the flange readings
The vena contracta is the contracted flow region associated with the local restriction; it is not simply another name for the downstream pressure tap. As velocity increases, static pressure can fall substantially below the recovered outlet pressure. Irreversible losses prevent complete recovery to the upstream condition. A high-recovery geometry regains a larger portion of its local pressure depression after the constriction.
The Fisher choked-flow bulletin illustrates high- and low-recovery pressure profiles. A larger recovery can mean a deeper local pressure minimum for the same upstream and downstream pressures. “High recovery” is consequently not a synonym for “less likely to cavitate.” The actual profile depends on the trim and operating opening, not just the valve’s nominal body type.
Vapour formation is common to two different outcomes
If local pressure reaches the fluid’s vapour-pressure region at its temperature, vapour can form. When downstream pressure recovers sufficiently above the relevant vapour pressure, those vapour structures collapse: this is cavitation. When the downstream thermodynamic state sustains vapour, the outlet remains a liquid–vapour flow or may become more extensively vaporized: this is flashing.
Flashing does not require all incoming liquid to become vapour. Its vapour mass fraction needs an energy/property calculation. Likewise, the presence of bubbles is not enough to identify cavitation: noncondensable gas released from solution need not collapse like vapour. Pressure, temperature, composition and downstream state must be interpreted together. Use absolute pressures when comparing with an absolute vapour pressure.
Collapse damage and two-phase erosion have different mechanisms
Vapour collapse close to a solid surface can produce intense local loading and rough material loss. Persistent high-velocity two-phase flow can erode surfaces through droplet impact and flow redirection. Noise and vibration may accompany either service, and adjacent downstream piping may contain the damaging region rather than the valve seat alone.
Emerson’s flashing guidance describes the roles of flow velocity, geometry and materials in erosion mitigation. Appearance is evidence to investigate, not a diagnosis by itself: corrosion, solid particles and prior damage can coexist. A material upgrade does not change the thermodynamic reason for vapour formation, although it may change resistance to a particular damage process.
Choked flow is a sizing condition, not the first bubble
For the simplified turbulent liquid model without attached fittings, the limiting sizing pressure drop is Δpchoked = FL²(p1 − FF pv). FL is the tested liquid pressure-recovery factor for the valve at the relevant opening; FF is a liquid critical-pressure-ratio factor. It is not a valve efficiency. With fittings, the appropriate combined geometry/recovery factors must replace this bare-valve form. Fisher’s published sizing derivation gives this limiting-drop relation; it is used here as a technical model, not a claim about the current edition of a standard.
Using the metric Kv convention, a corresponding simplified capacity estimate is Q = Kv √[min(p1 − p2, Δpchoked)/SG], with Q in m³/h, pressures in bar and SG dimensionless. Spirax Sarco explains the Kv unit convention. Incipient or damaging cavitation can occur before the fully choked limit; a non-choked sizing result is therefore not a certificate of cavitation-free service.
Worked example: identical Kv, different recovery factors
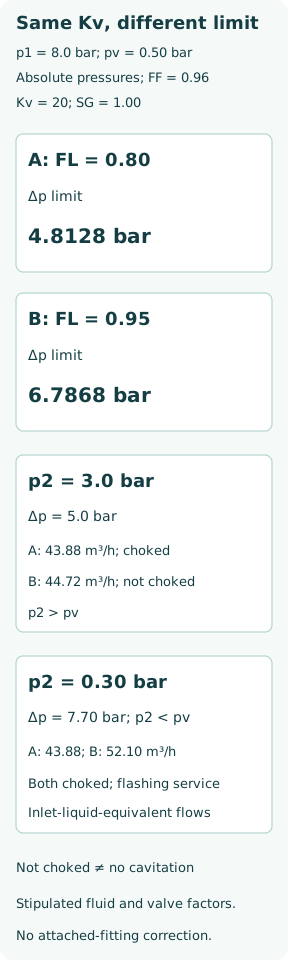
Choose hypothetical inlet p1 = 8.0 bar absolute, outlet p2 = 3.0 bar absolute, pv = 0.50 bar absolute, SG = 1.00, FF = 0.96 and Kv = 20. These are stipulated teaching inputs for a generic liquid; FF = 0.96 is a stipulated rounded limiting approximation; the usual relation is FF = 0.96 − 0.28√(pv/pc), where pc is absolute critical pressure. No unstated real fluid is implied. Assume turbulent service and no attached fitting correction. Compare valve A with FL = 0.80 and valve B with FL = 0.95 at their stated openings.
The available end-to-end drop is 5.00 bar. The common thermodynamic term is 8.0 − 0.96 × 0.50 = 7.52 bar. Valve A has Δpchoked = 0.80² × 7.52 = 4.8128 bar; valve B gives 0.95² × 7.52 = 6.7868 bar. The same 5 bar drop exceeds A’s limit but remains below B’s. These assumed factors are not assigned to a particular commercial valve.
Apply the limiting drop and interpret the result
Ignoring choking would give Q = 20√5 = 44.72 m³/h for either valve. The simplified limited calculation gives A: 20√4.8128 = 43.88 m³/h; B: 20√5 = 44.72 m³/h. A is choked in this model. Since the stipulated outlet pressure of 3 bar is above pv = 0.5 bar, vapour formed in A can collapse as pressure recovers: the relevant regime is cavitation rather than persistent flashing at that outlet state.
B’s non-choked result says only that this limiting capacity condition has not been reached. It does not establish B’s incipient-cavitation threshold, allowable noise, vibration or erosion rate. Nor does the small difference in calculated flow imply that the damage risk difference is small. Manufacturer cavitation data and the complete duty range are needed for that decision.
Lowering the outlet pressure changes the downstream phase problem
For a separate case, hold the stipulated inlet and fluid-property inputs fixed but lower p2 to 0.30 bar absolute. The total drop becomes 7.70 bar, exceeding both limiting drops. A’s simplified inlet-liquid capacity remains 43.88 m³/h, while B’s is 20√6.7868 = 52.10 m³/h. The naive unbounded expression would instead give 55.50 m³/h. These are inlet-liquid-equivalent capacities, not the actual expanded outlet-mixture volume.
Now p2 is below the stipulated inlet-temperature vapour pressure, indicating flashing service. In an actual flash the fluid cools and its downstream equilibrium composition/temperature must be calculated from enthalpy and pressure; the fixed-property example only classifies and sizes approximately. Changing trim alone cannot guarantee a wholly liquid outlet when the system-imposed thermodynamic state requires vapour.
Match the remedy to cavitation or flashing
For cavitation, an engineered pressure-drop distribution can keep local minima from crossing the relevant vapour boundary, or move and reduce damaging collapse. Spirax Sarco describes staged/perforated anti-cavitation trim. Stage count alone is insufficient: the distribution must work across the operating range and remain compatible with solids, fouling and minimum controllable flow.
For flashing, evaluate outlet area, two-phase velocity, direction changes and resistant materials, together with downstream piping. Changing system pressure or the inlet thermal state can change the phase outcome; a different label on the valve cannot. A downstream restriction sometimes changes recovery and backpressure, but it can also move the problem elsewhere and must be analysed as part of the system.
Specify the whole envelope, then verify the evidence
Record fluid composition, inlet temperature, vapour-pressure/property basis, minimum and maximum p1/p2, required flow, opening, piping geometry and all relevant startup/shutdown duties. Specify which pressure reference is used. Ask separately for flow capacity, cavitation assessment, flashing suitability, noise/vibration and material limits rather than accepting a single Kv as the complete answer.
Operational evidence should combine pressure and temperature histories, actual flow, valve position and inspected damage location. A quiet moment or an acceptable average flow does not establish a safe lifetime. The essential distinction is the pressure path: local vapour formation followed by collapse is different from a system that continues to carry vapour downstream.