Knowledge / Machinery and energy
Membrane nitrogen generation: purity, recovery and compressed-air demand
Follow selective permeation, distinguish product purity from nitrogen recovery, and calculate the compressed-air penalty of two assumed purity/flow operating points.
On this page
A membrane nitrogen generator does not turn oxygen into nitrogen. It separates a compressed-air feed into a nitrogen-rich product and a faster-permeating stream. Some nitrogen is lost with that stream, so product purity and nitrogen recovery are different quantities. The upstream compressor can dominate the energy account even when the membrane module itself has little electrical demand.
Selective permeation creates two outlet streams
In a typical hollow-fibre arrangement, compressed air passes along the fibres while faster-permeating gases cross their walls. The remaining retentate is nitrogen-rich; the permeate is enriched in species that cross more readily. The process depends on solution/diffusion behaviour and partial-pressure differences, not a mechanical sieve with holes that pass only one molecular size.
Parker’s membrane description identifies the hollow-fibre, retentate and permeate paths. A conceptual species flux can be written Ji = Πi Δpi, where Πi is an appropriately defined permeance and Δpi its partial-pressure driving difference. Temperature, pressure and composition affect performance. This expression alone is not a module-sizing equation.
Purity, product yield and recovery have different denominators
Let F be feed molar flow, P product flow and W permeate flow. At steady state with no leaks, F = P + W. If z, x and y are nitrogen mole fractions in feed, product and permeate, the nitrogen balance is Fz = Px + Wy. Product purity is x; product yield is P/F; nitrogen recovery is Px/(Fz). Stage cut, when defined as permeate/feed, is W/F.
These definitions should accompany every quoted percentage. A product that is 99% nitrogen need not recover 99% of the feed nitrogen. A high-quality but small product stream can discard substantial nitrogen with the permeate. Conversely, increasing product withdrawal may improve yield while leaving more oxygen in the product, depending on the module and operating point.
State what the purity instrument actually measures
Many systems assess product quality through residual oxygen. Real air also contains argon and other constituents, so “100% minus oxygen” is not necessarily the molecular N2 fraction. Atlas Copco explains that argon permeates slowly and can remain with the nitrogen-rich stream. The application’s specification may define purity using a particular residual-oxygen convention; identify it explicitly.
The following arithmetic uses an intentionally binary dry feed of 79% N2 and 21% O2, with argon and all other species omitted. In that model alone, nitrogen fraction is exactly one minus oxygen fraction. All normal-volume flows share a declared reference of 0°C and 1.01325 bar absolute and ideal-gas behaviour, so they are proportional to molar flow. These reference volumes are not actual compressed-pipe volumes.
Worked example: 99% product with 50.13% nitrogen recovery
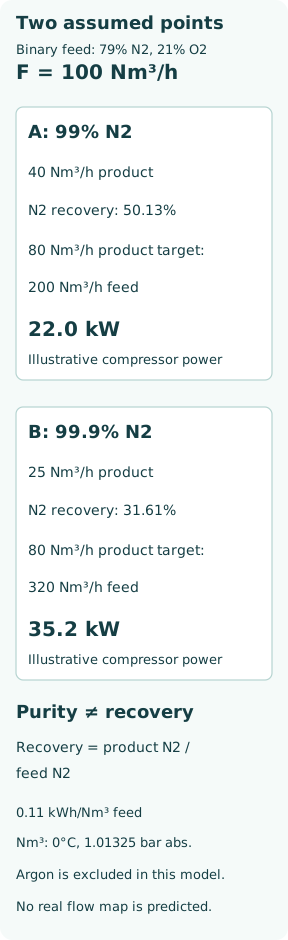
Assume F = 100 Nm³/h and a hypothetical product P = 40 Nm³/h at x = 0.99. Feed nitrogen is 100 ×0.79 = 79 Nm³/h on the common reference basis. Product nitrogen is 40 ×0.99 = 39.6 Nm³/h. Permeate flow is 60 Nm³/h, containing 79 −39.6 = 39.4 Nm³/h nitrogen.
Permeate nitrogen fraction is 39.4/60 = 0.65667; its oxygen fraction is 0.34333. Nitrogen recovery is 39.6/79 = 50.13%, product yield 40% and stage cut 60%. Thus 99% purity, 50.13% recovery and 40% yield are all correct for the same assumed point. The outlet balances close for both species.
A higher-purity point can require more feed for the same product
For a second assumed point on the same 100 Nm³/h feed, choose product 25 Nm³/h at 99.9% N2. This flow is stipulated to illustrate a trade-off; it is not predicted from purity alone. Product nitrogen is 24.975 Nm³/h, permeate 75 Nm³/h and permeate nitrogen 54.025 Nm³/h. Recovery is 24.975/79 = 31.61%; product yield 25% and stage cut 75%.
To deliver 80 Nm³/h product at the first assumed yield requires 80/0.40 = 200 Nm³/h feed. At the second it requires 80/0.25 = 320 Nm³/h. A real supplier curve must establish the achievable combination at the specified pressure, temperature and module configuration. Air Products’ shipboard-system data presents different capacities at different purities; there is no single capacity independent of quality.
Translate air demand into the correct energy boundary
Assume the complete feed-air compression process requires 0.11 kWh per normal cubic metre under the stated supply conditions. This is an invented specific-energy input, held constant for the comparison. The first 80 Nm³/h product case requires 200 ×0.11 = 22.0 kW; the second requires 320 ×0.11 = 35.2 kW.
Compressor energy per product volume is then 22/80 = 0.275 kWh/Nm³ and 35.2/80 = 0.440 kWh/Nm³. These values exclude any separately powered dryer, heater, product booster or control loads unless they are included in the stipulated 0.11 figure. A membrane cabinet’s electrical nameplate does not represent this upstream compressor work. Real compressor specific energy also changes with pressure, part load and air-treatment pressure losses.
Feed-air quality protects the separation surface
Liquid water, oil aerosols or vapour and particles can compromise a membrane system if they exceed its specified feed quality. Filtration, separation, drainage and any required drying or heating must match the selected module. Do not assume that one generic dryer is always required or that the membrane’s preferential water permeation makes any wet feed acceptable.
Parker shows coalescing and activated-carbon pretreatment in its membrane arrangement. Those components have distinct duties; a particle filter alone is not proof of oil-vapour control. Check pressure loss and condition as well as element presence. The required air-quality class and replacement criteria come from the particular supplier, not from the binary balance above.
Pressure, temperature and demand transients affect useful delivery
Increasing feed pressure can increase the separation driving force, but it also increases compression work and must remain within the module’s limits. Product back-pressure and permeate pressure influence the actual partial-pressure differences. Temperature can change permeability and selectivity; a capacity correction must use the supplier’s declared basis rather than a universal multiplier.
During startup or a demand step, pressure and oxygen concentration may not immediately meet the required condition. Product-quality monitoring, off-spec diversion where provided, receiver capacity and downstream demand belong to the delivery assessment. A purity reading upstream of a leaking line does not establish the oxygen concentration at the point of use.
A complete specification includes both outlets and the consumer
Specify product flow, residual oxygen or true composition basis, pressure, dew point, feed-air conditions, recovery/air demand, utility boundary and required availability. For a tank application, generator purity is not itself evidence that the tank has reached its required atmosphere; mixing, displacement, leakage and sampling create another system boundary.
Nitrogen-rich gas can create an oxygen-deficient atmosphere, while the permeate can be oxygen-enriched. Both streams need the designed routing and ventilation. Never assess safety by smell or assume that a normally vented separation stream is ordinary air. The central engineering task is to meet the consumer’s actual specification while closing total-flow and species balances and counting the compressed air needed to do so.