Knowledge / Navigation and marine safety
Ship evacuation capacity: bottlenecks, counterflow and mobility
Use an original transient queue to distinguish route inflow, bottleneck throughput, counterflow and planned assistance from certified ship evacuation performance.
On this page
Evacuation capacity depends on the route people must actually use and the tasks occurring along it. A wide approach corridor cannot remove a restriction farther downstream, and a final head count does not reveal where people accumulated. A deliberately simplified queue shows how a short change in passage throughput can persist after the change itself has ended.
Define which part of evacuation is being measured
Travel toward an assembly area, passage through an opening, embarkation and launching are different stages. A rate measured at one doorway cannot represent all of them. The population assigned to a route, their initial locations and their response times affect when demand reaches that doorway. The relevant time origin must therefore be stated before comparing apparent completion times.
IMO MSC.1/Circ.1533 separates response, travel, embarkation and launching in its evacuation-analysis framework. The calculation here is only a fictional local queue. It is neither the circular's simplified method nor its advanced method, and it contains none of the required ship scenarios, validation or acceptance assessment needed to claim an approved evacuation result.
Follow bottlenecks through the route
A route's clear geometry changes at doors, turns, stairs, obstructions and merging points. Adding upstream width can move a queue without increasing discharge through a downstream restriction. Two routes drawn separately may also share a final passage, crew resource or embarkation station. Their nominal individual capacities cannot simply be added if that common element governs the combined flow.
Capacity is consequently a relation between geometry, movement and conditions, not a permanent number painted on a plan. A model must state how people are allocated, where they can wait and whether downstream congestion can block upstream movement. The following example removes those spatial effects on purpose so the conservation of arrivals, departures and waiting population remains transparent.
State the continuous-flow teaching assumptions
Assign 96 people to one fictional passage. Arrivals occur uniformly at λ = 1.6 people/s from t = 0 to t = 60 s, then stop. Initially nobody waits. Normal passage throughput is μ = 1.2 people/s while a queue exists. Arrival and service begin together; no separate travel or reaction delay is included in the time origin.
Treat people as a continuous flow for this bookkeeping example. A fractional intermediate count represents the idealization, not a fraction of an actual person. There is unlimited waiting space, no overtaking, no route choice and no feedback from crowd density. Rates are invented inputs. They are not observed pedestrian data, recommended flow rates or capacities derived from a stated door width.
Compute the constant-throughput baseline
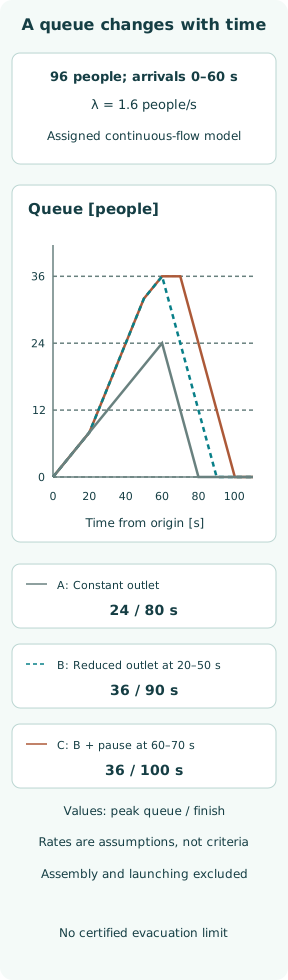
While arrivals exceed departures, the waiting population Q grows at dQ/dt = λ − μ = 0.4 people/s. Case A therefore reaches Q(60) = 24 people. Arrivals then cease, and the queue drains at 1.2 people/s. The remaining 24/1.2 = 20 s gives a local completion time of t = 80 s.
Conservation provides a separate check: 1.2 × 80 = 96 people have passed, equal to all arrivals. Peak queue is 24 in this ideal case. Neither 80 s nor 24 people is an evacuation target or a permissible crowd size. The model has no waiting-area dimensions, so it cannot convert that count to density or establish whether the queue can be accommodated.
Represent a temporary counterflow effect explicitly
For case B, stipulate that an opposing movement reduces available forward throughput to 0.8 people/s from t = 20 to 50 s, with 1.2 people/s otherwise. This is an assigned service profile, not a universal counterflow factor. At 20 s the queue is 8; it then grows at 0.8 people/s for 30 s, reaching 32 at 50 s.
During the final ten seconds of arrivals, normal throughput resumes and the queue grows to 36. It then needs 30 s to drain, giving t = 90 s. The temporary reduction adds 12 waiting people at t = 60 and ten seconds to completion. Its consequence persists after counterflow ends because the accumulated queue still has to pass through the same outlet.
Read the graph as population bookkeeping
The original figure plots Q against elapsed seconds for three assigned profiles. Case A peaks at 24 and ends at 80 s; B peaks at 36 and ends at 90 s. The segments are straight because each interval has constant arrival and departure rates. A flat zero line after completion means the local queue is empty, not that everyone is aboard survival craft.
No individual walking speed or path is plotted. The graph cannot show whether two people can pass each other, whether the approach becomes congested or whether the selected route remains usable during a casualty. Those omitted effects can change the rate profile itself. A precise arithmetic answer is conditional on the assumed service model, even when every plotted point is numerically correct.
Make assistance a planned service requirement
Case C adds an invented ten-second station pause from 60 to 70 s to case B. During this pause forward throughput is zero and no further arrivals occur, so Q remains 36. Normal service then drains the queue in 30 s, producing t = 100 s. Peak waiting population is unchanged, but completion is ten seconds later.
The pause represents a hypothetical station task, not a predicted duration for a disability or a reason to exclude anyone. Real assistance should be planned around people's needs, suitable equipment, crew roles and route access. The advanced framework represents individuals with differing abilities and response durations; averaging everyone into one walking speed can hide who needs a different supported path.
Include the transfer and communication interfaces
A passage may empty into an assembly area that has its own constraints, or into an embarkation task whose pace is different again. Moving a queue out of one model boundary does not make it disappear from the ship. The handover between route control and the receiving station must account for available space, readiness and the people still approaching.
MCA MGN 344 records historical domestic-vessel exercise observations about communication, mobility and transfer geometry. These observations do not supply rates for this example or universal rules for every passenger ship. They illustrate why a route analysis should retain the receiving task and clear instructions as separate evidence questions rather than reduce evacuation to the narrowest door alone.
Keep assumptions separate from approved analysis
For B, discharge is 1.2 × 90 − (1.2 − 0.8) × 30 = 96 people. For C, subtract a further 1.2 × 10 from 1.2 × 100 and the same counterflow loss to obtain 96 again. These checks conserve population; they do not validate the assigned rates or the model's unlimited waiting-space assumption.
The cited MSC.1/Circ.1533 is the 6 June 2016 instrument in the current Netherlands Shipping Inspectorate record checked on 8 October 2026. No later revision or corrigendum was located in the targeted source check; that is a bounded research result, not a claim that a simplified teaching queue meets all current ship requirements. Applicability and approval belong to the vessel's actual analysis basis.
Use the model to expose the missing decision inputs
The three local completion times are 80, 90 and 100 s under the stated assumptions. Their differences show how a temporary capacity reduction and a separate station pause affect a queue. They do not establish an allowed passenger count, a certified evacuation limit or an available time before fire, smoke, flooding or loss of stability makes a route unusable.
A reviewable evacuation assessment must connect people, accessible routes, assistance, counterflow, waiting areas and the destination, with evidence for each scenario. Faster average movement cannot compensate for a person who has no supported way through an interface. The useful result of this elementary calculation is an explicit demand-and-service history that reveals where more realistic physical and human evidence is needed.
Sources
- IMO MSC.1/Circ.1533: revised guidelines on evacuation analysis. 6 June 2016; Netherlands Shipping Inspectorate record PUC_642556_14/1 marks current, updated 17 March 2026; no later revision/corrigendum located in targeted official checks — Annex 1 scope/reporting; Annex 2 assumptions; Annex 3 individual abilities and verification. Actual 46-page IMO PDF inspected 2026-10-08; toy queue is not this method
- MCA MGN 344 (M): observations from domestic passenger-vessel evacuation exercises. November 2007, reporting 2006 exercises; retained as historical observations, not universal evacuation rates — §§3.2–3.4 and 4: communication, accessibility, freeboard and transfer interfaces; actual 8-page PDF inspected 2026-10-08